
Hey guys! How are you? Excited for another post???
Introduction
Today I want to chat with you about something that can be a real “gotcha” for those who are migrating from SQL Server On-premises (or even Azure SQL Database) to Azure SQL Managed Instance (MI) and that I learned in practice.
You know that classic DBA routine of looking at a log file that has grown too big after heavy maintenance and thinking: “I'm going to run a Shrink here to free up this unused space”? Well, in Managed Instance, specifically in the General Purpose – Standard tier, this “good practice” can become your worst performance nightmare.
The Scenario: The Shrink Habit
In the On-premises world, keeping data and log files at the “just” size is almost a mantra to save storage and maintain organization.
In my case, I was working in a very large environment, I saw a log file that had 900 GB of space allocated and less than 1 GB used. Especially when it comes to log files, it's natural for any SQL Server DBA to immediately think about running a shrink to recover this allocated space, right? This is where the problem lies when the database in question is in an Azure SQL Managed Instance in the General Purpose tier.
In Azure SQL Managed Instance, if you are using the newer tiers such as Next-gen General Purpose or Business Critical, you have greater flexibility and the problem that I will detail in this post does not happen. But the vast majority of environments still run on General Purpose (Standard), and this is where the bug catches on.
Unlike a local disk where IOPS is usually fixed by the type of disk, in Managed Instance General Purpose, I/O performance (IOPS and Throughput) is directly proportional to the size you allocate to the file.
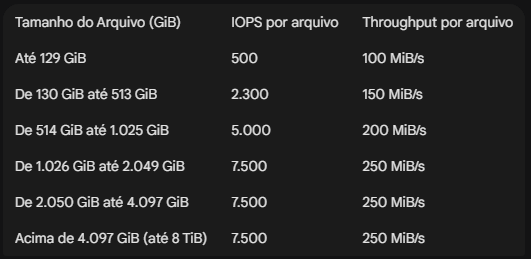
This means that Azure reserves performance for you based on the size of the file, whether it is the data file (mdf) or log file (ldf). If you have a 1.1 TB log file, you have a 7500 IOPS limit. If you run a shrink and this file drops to 100 GB, you have just reduced the disk's IOPS to 500, reducing the performance of your disk (and the bank) by 15x, often without realizing it.
According to the official Microsoft documentation, scaling works in bands.
File size and IOPS ranges:
The Real Problem: The “Domino Effect”
Imagine that you ran shrink on the log at 9pm in a maintenance routine. The file went from 600GB to 50GB. At 8am, several jobs are taking much longer to execute, the application is running slowly and everyone is complaining to you. Since the log now only has 500 IOPS (instead of 5,000), each INSERT, UPDATE or DELETE takes 10x longer to commit the commit to disk.
The result? Wait types of LOG_RATE_GOVERNOR or WRITELOG at the top, slow application, users complaining and you look at the CPU and see that everything is low. Then you think: “But I didn’t change anything, I just cleaned the log!” lol.
And now, what to do?
The recommendation here changes the mindset of the traditional DBA a little:
- Avoid Shrink: If your log file has grown to 200 GB and you know that it periodically needs that space for maintenance or loads, leave it there. The cost of extra storage is much lower than the cost of downtime or application slowness.
- Monitor the IOPS ranges: You can even run Shrink, but be careful not to change the IOPS performance ranges and whether this reduction in disk speed will have an impact. Before reducing a file, check the documentation to make sure you won't fall into a lower “performance range”.
- Evaluate Next-gen GP: If disk performance is a constant bottleneck and you need flexibility, consider moving to the Next-gen General Purpose tier, where IOPS is isolated from file size (you can pay for as much IOPS as you want).
To help you identify the speed range of each file in your environment, I prepared a simple script to help you on a daily basis:
SELECT
    DB_NAME(database_id) AS [Database Name],
    [name] AS [Logical Name],
    [type_desc] AS [File Type],
    CAST(size * 8.0 / 1024 / 1024 AS DECIMAL(10, 2)) AS [Size (GiB)],

    -- Lógica baseada nos tiers oficiais de IOPS
    CASE
        WHEN (size * 8.0 / 1024 / 1024) <= 129 THEN 500
        WHEN (size * 8.0 / 1024 / 1024) <= 513 THEN 2300
        WHEN (size * 8.0 / 1024 / 1024) <= 1025 THEN 5000
        ELSE 7500
    END AS [Official IOPS],

    -- Lógica baseada nos tiers oficiais de Throughput (MiB/s)
    CASE
        WHEN (size * 8.0 / 1024 / 1024) <= 129 THEN 100
        WHEN (size * 8.0 / 1024 / 1024) <= 513 THEN 150
        WHEN (size * 8.0 / 1024 / 1024) <= 1025 THEN 200
        ELSE 250
    END AS [Official Throughput (MiB/s)],

    physical_name AS [Physical Path]
FROM
    sys.master_files
WHERE
    database_id > 4
ORDER BY
    [Size (GiB)] DESC;
Conclusion
If you're feeling like your WRITELOG is high, take a look at your log file size. If it is 100 GB, you are limited to 500 IOPS. If you increase this file to 514 GB (even if you don't use all that space), Azure will free you 5,000 IOPS instantly!
It's worth remembering that this applies to the size of the data file too, it's not just for the log file.
Sometimes “wasting” a little storage is the best investment you can make in the performance of your database in Azure.
I hope you enjoyed this update, a big hug and see you next time!

Comentários (0)
Carregando comentários…