Hey guys,
Goodnight!
In this post I will demonstrate a tool used by 99.99% of SQL Server DBA's around the world and you probably already know it, which is the excellent and very famous stored procedure sp_WhoIsActive, by Adam Machanic, which allows us to obtain a series of information about the active sessions of a SQL Server instance such as the query being executed, the user executing it, the wait event, execution time, CPU usage, Tempdb usage, disk reads (IO) and much more.
The objective of this post is to demonstrate this tool and how different parameters and customizations change the final result of the Stored Procedure. Nowadays, many DBA's always use this SP with the default parameters, either due to a lack of knowledge about the parameters or even their existence.
Before starting, I will make the latest version of the sp_WhoIsActive for you to download, if you are unable to download it from Adam Machanic's website.
UPDATE: On 07/25/2017 I made a query available that would be a “compact version” (lite) of sp_WhoIsActive. Take a look in this post.
If you are visiting this article looking for performance tips, also read my series of articles on this subject:
– Understanding how indexes work in SQL Server
– SQL Server – Performance comparison between Scalar Function and CLR Scalar Function
– SQL Server – Introduction to the study of Performance Tuning
– SQL Server – How to identify a slow or heavy query in your database
I hope you like this series 🙂
A little more about sp_WhoIsActive
Description of columns Using help from sp_WhoIsActiveConsulting the sp_WhoIsActive help
This tool has its own help, and we can access it using the parameter @help = 1:
EXEC sp_whoIsActive @help = 1
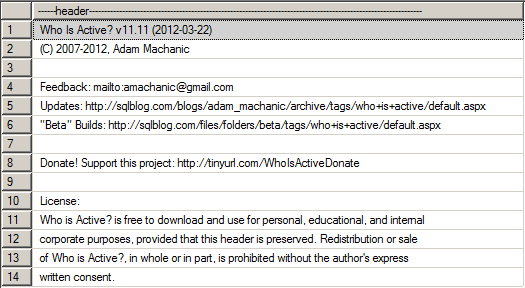
and the output is divided into 3 resultsets:
Information about the creator of SP
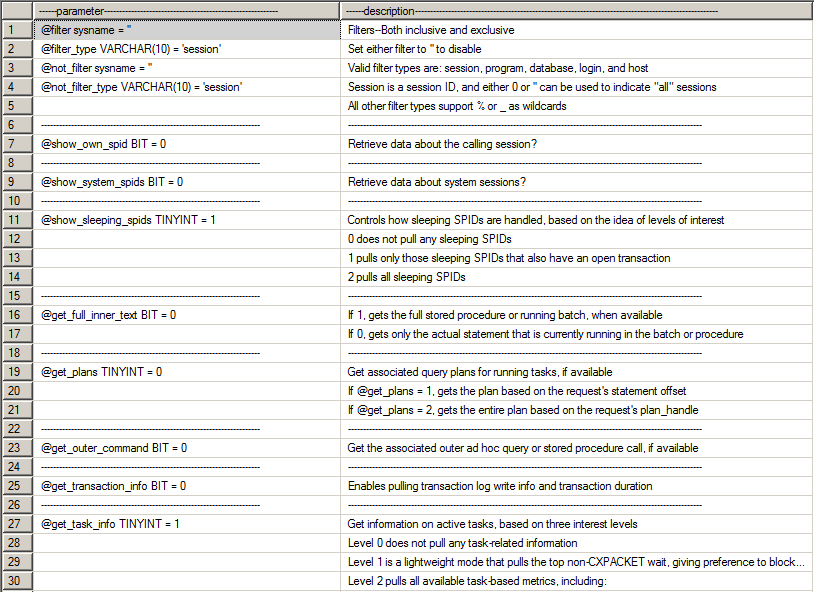
Description of SP call parameters
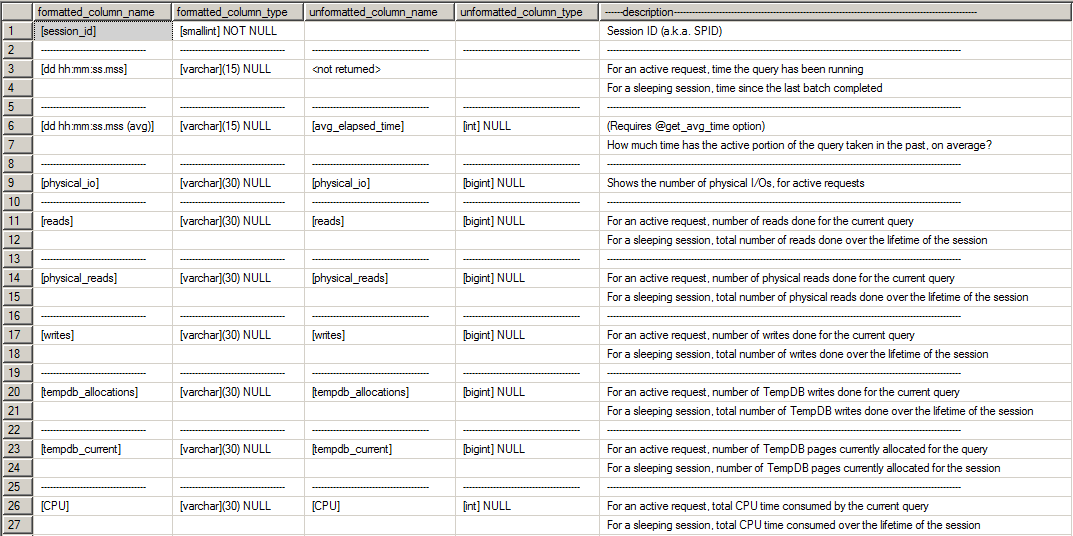
Description of the columns returned by SP
Minimum permissions required to run SP
One of the important points to comment on is the minimum permissions required to use sp_WhoIsActive. I've seen many DBA's grant sysadmin access to a user, so that he can use this SP, because he doesn't know what needs to be released for the user to execute the Stored Procedure on the instance, since the most common thing is to try to release just the EXECUTE permission on the Stored Procedure.
If you do not release the view server state permission, you will see the error message below:
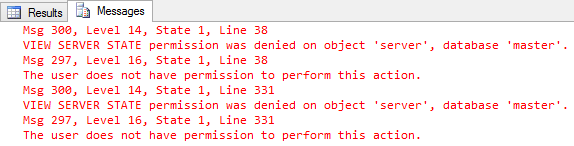
To do this, simply execute the command below, so that the user can use sp_WhoIsActive normally:
USE [master]
GO
GRANT EXECUTE ON dbo.sp_WhoIsActive TO [dominio\usuario]
GRANT VIEW SERVER STATE TO [dominio\usuario]
GO
Using parameters in sp_WhoIsActive
Default execution, no parametersPart 1:

Part 2

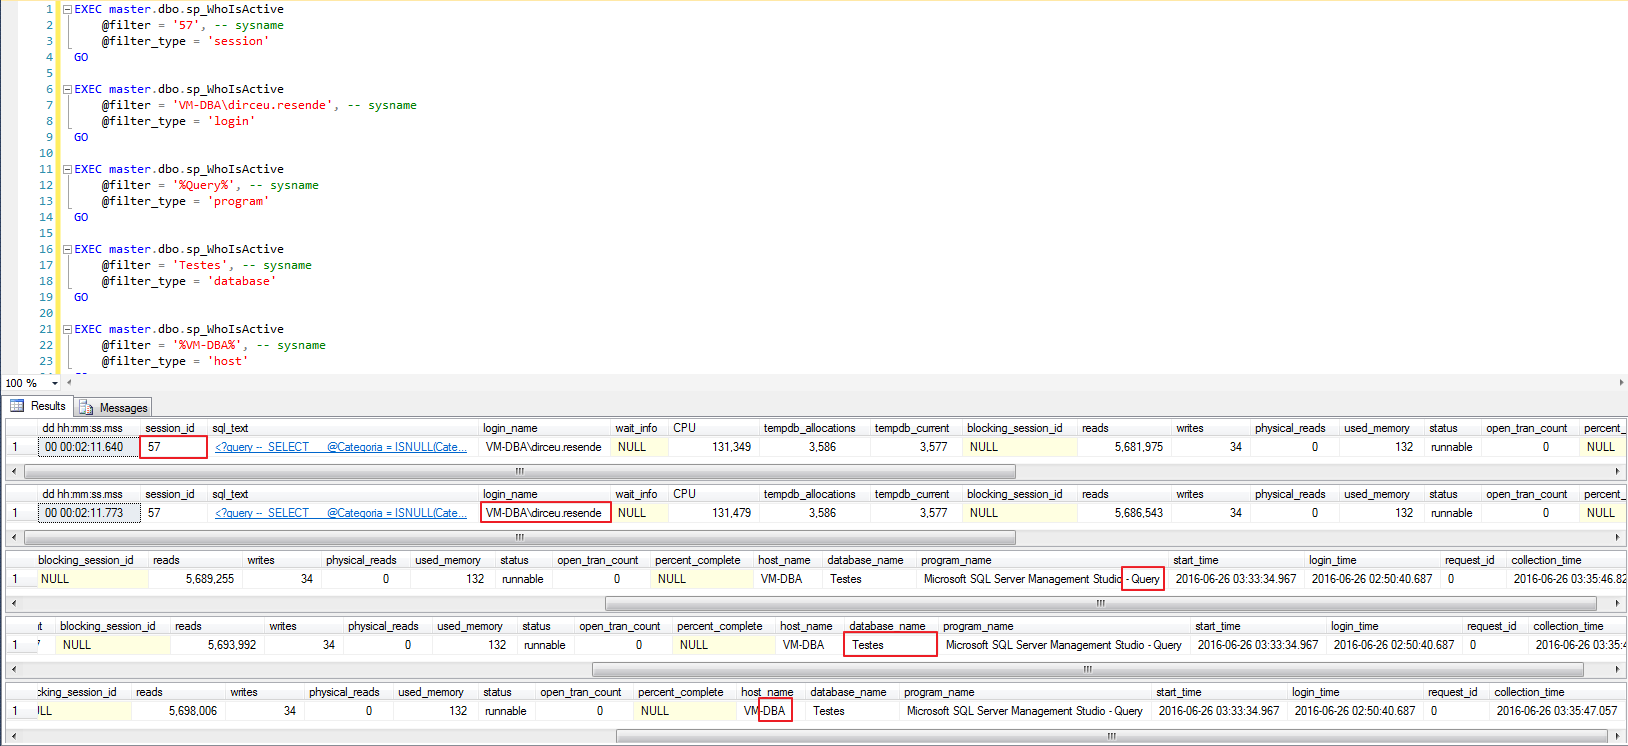
The @filter parameter allows us to define what we want to search for (supports the wildcard % to perform searches like LIKE ‘%string%’), while the @filter_type parameter allows us to define where we want to search for this information. The possible types for @filter_type are:
- session: Allows you to search for a specific session
- program: Allows you to search for sessions that are using a specific client software to connect to the database
- database: This type of filter is used to filter queries being executed on a given database
- login: Filter used to filter the sessions of a specific user
- host: Use this filter to only view sessions coming from a specific hostname
Examples of using inclusive filters (@filter and @filter_type):
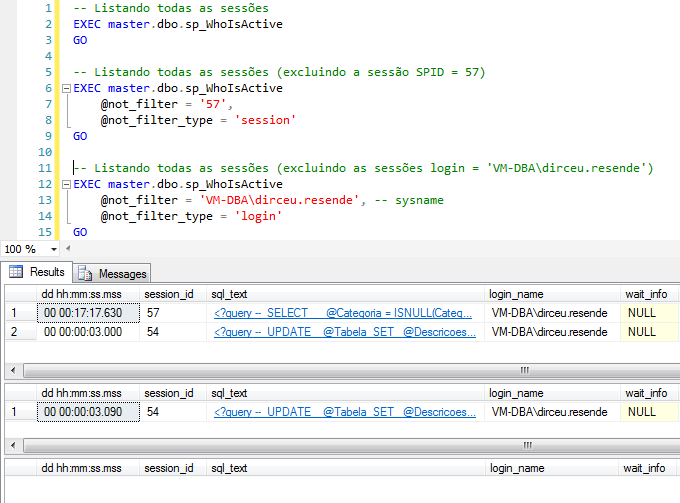
Examples of using unique filters (@not_filter and @not_filter_type):
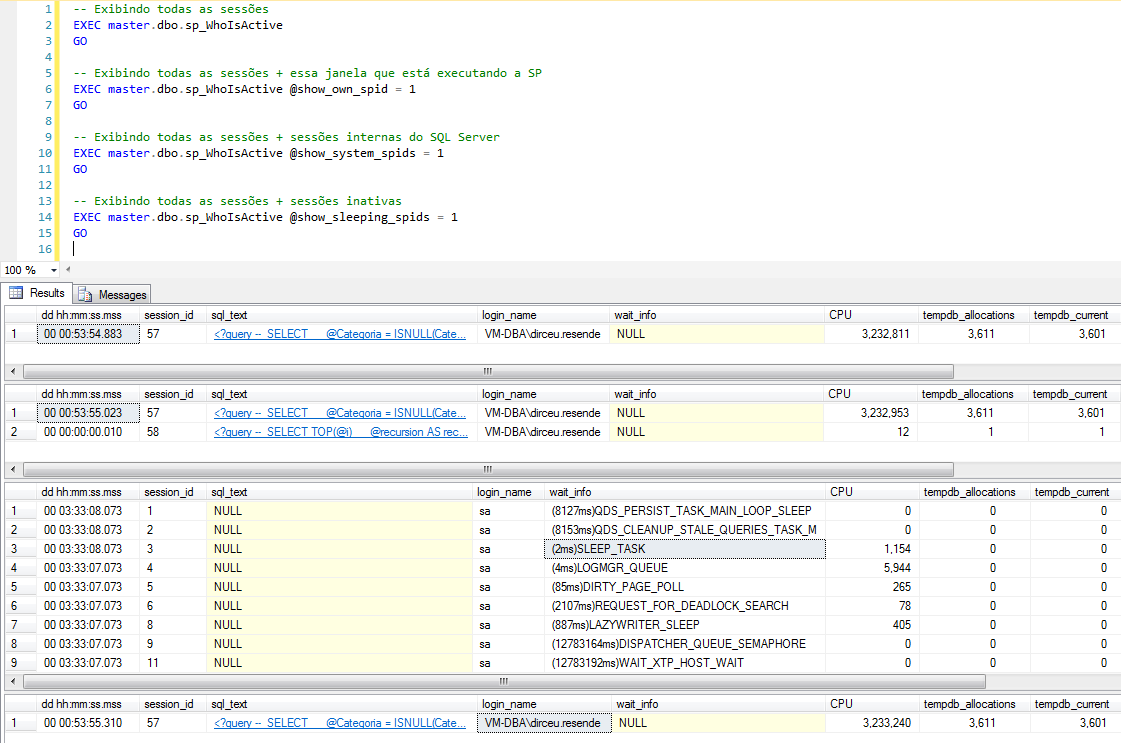
The @show_own_spid (BIT) parameter determines whether the session that is executing the procedure will be part of the final result that will be shown on the screen. The default value is 0 (zero), meaning that the session itself is not shown by default.
The @show_system_spids (BIT) parameter determines whether internal SQL Server system sessions will be displayed in the final SP result. The default value is 0 (zero), causing these sessions to be ignored.
The @show_sleeping_spids (TINYINT) parameter determines whether inactive sessions (sleeping) will be displayed in the final SP result. The default value is 0 (zero), causing these sessions to be ignored. The value 1 displays all inactive sessions that have an open transaction and the value 2 displays all inactive sessions.
Usage examples:
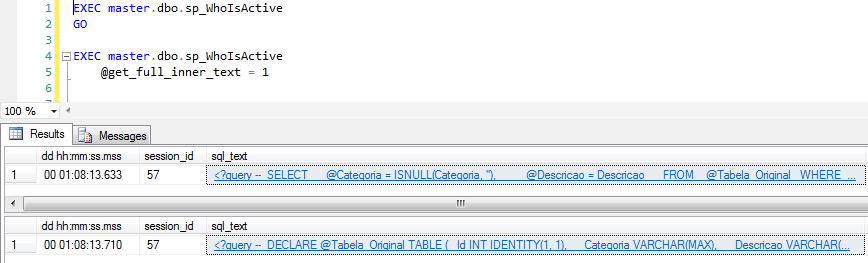
@get_full_inner_text
By default, the SQL statement that is returned in XML form in the sql_text column is just the batch that is currently being processed. By using this parameter, we can observe the entire content of the batch that was sent to SQL Server for processing.
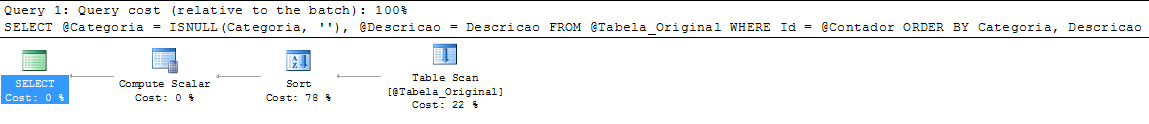
@get_plans
When using this parameter with the value 1, a demonstration of the execution plan for the current query of each session returned by this SP will be generated. Using the value 2 in this parameter, the execution plan for the entire session query is generated. When clicking on the ResultSet XML, Management Studio already displays the execution plan for this query. Fantastic!
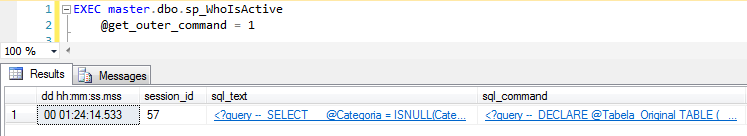
@get_outer_command
This parameter is similar to @get_full_inner_text, but instead of replacing the value of the sql_text column, it keeps this column with its default value (only the executing section) and adds a new column called sql_command, which contains the entire query that the session is executing. In this way, we have both views.
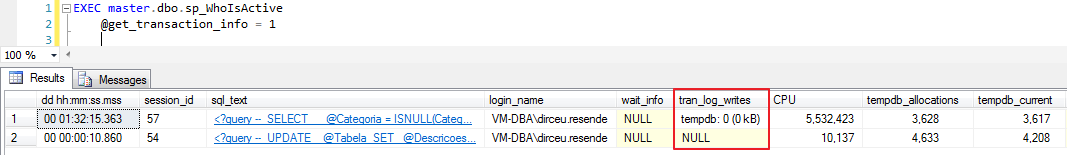
@get_transaction_info
Using this parameter, we can view the amount and volume of data written to the transaction log for each session.
@get_task_info
A very interesting parameter for performance analysis, @get_task_info allows you to view more information about running sessions. By using the value 1, we can view the largest wait events (other than CXPACKET).
When using parameter 2, we will visualize the complete mode, which includes the columns:
- physicial_io: Shows the number of physical reads/writes (I/O) on the disk
- context_switches: Shows the number of context switches for the active connection. A context switch is when the OS kernel switches the processor from one thread to another (e.g. a higher priority thread).
This indicator is very important for identifying whether a process is using the CPU more than other processes and preventing them from reaching the processor. A very high index means that there is a lot of competition on the processor and it may be overloaded. A low number means that some process is allocating more CPU than it should, generating a lot of waiting time (and probably sessions with Pending and Runnable status).
Expected values should be something below 2,000 changes per processor/second (some DBA's consider a value below 5,000 as acceptable). Very high values may be caused by physical memory (RAM) allocation failures. Another possible aggravating factor is Intel® Hyper-Threading technology, which in some cases can cause many context changes due to the simulation of virtual cores. If you are experiencing this problem, a good test is to disable this feature on the server's motherboard and perform performance tests.
- tasks: Number of tasks being used by the current execution.
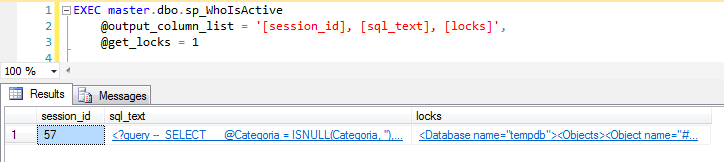
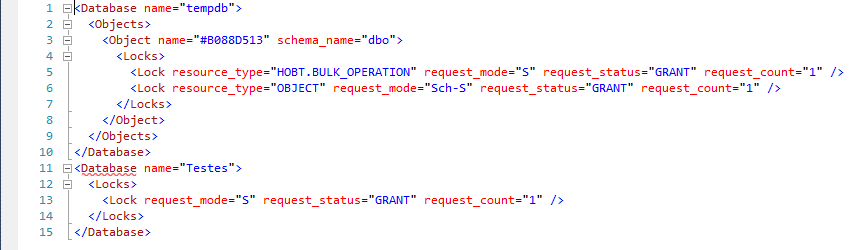
@get_locks
Very useful parameter for maintaining and identifying locks on the instance. When activated, it shows the reserved objects for each request, as well as the type of lock requested by the session.
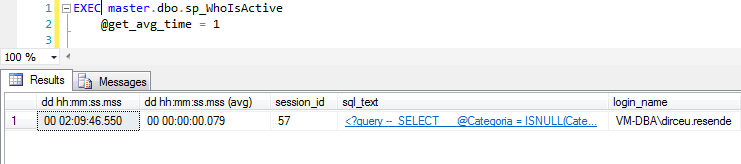
@get_avg_time
Using this parameter, a new column appears in the final result (dd hh:mm:ss.mss (avg)). This column shows the average execution time of the current query being executed by each session. As you can see in the example, my query has been running for more than 2 hours, but the current section is taking an average of 79 ms, in a loop of 850,000 iterations. This time is estimated based on the plan and execution histories.
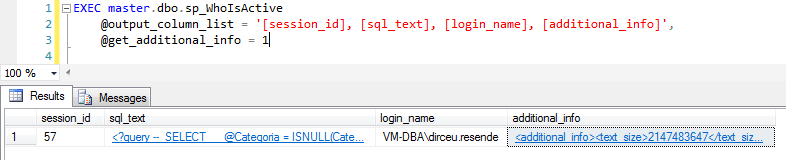
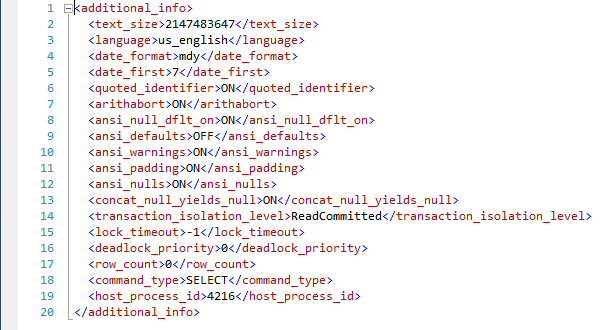
@get_additional_info
Using this parameter, a new column will be created in the final result called “additional_info”, which is an XML with various information and SET command definitions for each session, as shown in the example below:
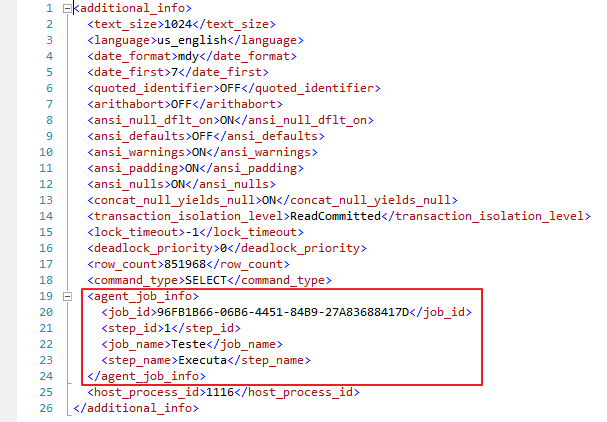
If a SQL Server Agent job is running, the additional_info column of that session that the Job opened will have the Job information:
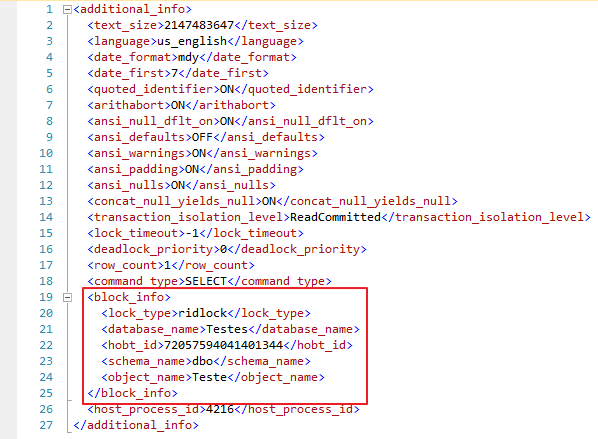
If you use the parameters @get_task_info = 2 and @get_additional_info = 1 and there is a lock in a session, the XML in the “additional_info” column of that session that is locked will have a node called block_info with the block information:
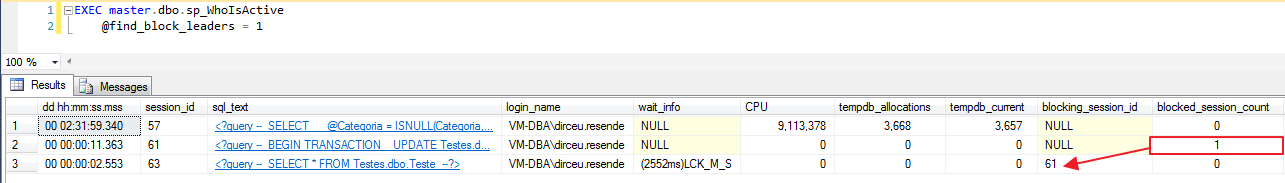
@find_block_leaders
One of my favorite parameters, @find_block_leaders when activated, allows you to analyze each session and count how many other sessions are in lock waiting for objects to be released by that session. Do you know when lock events start in your production instance and you have to keep looking for who is causing these locks? This parameter is the solution for you.
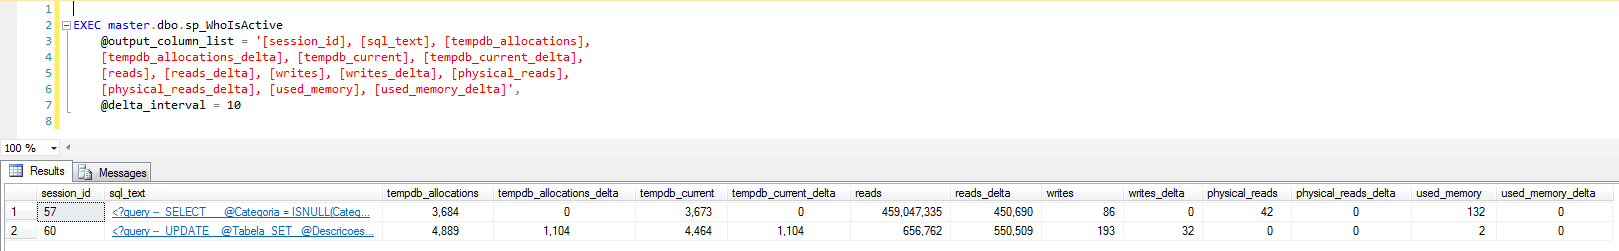
@delta_interval
This interesting feature allows you to perform two data collections in a given period of time (this period is the value of the parameter, in seconds) and analyze the difference in tempdb allocation, reads, writes, etc. between the two collections carried out.
In the example below, I specified a 10 second interval between each collection. At the end of 10 seconds, columns with the suffix “_delta” will be created, demonstrating the difference between the first and second execution.
This is very useful for analyzing tempdb allocation growth or real-time disk reads. Often, analyzing only the total session and current allocation is not enough to estimate the growth and allocation of resources, making this feature very interesting for DBA's.
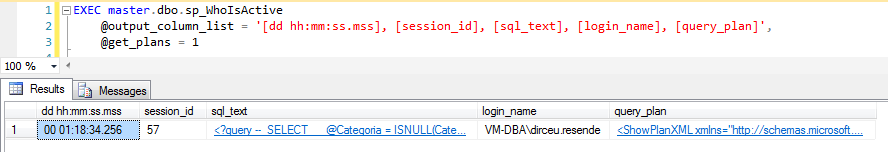
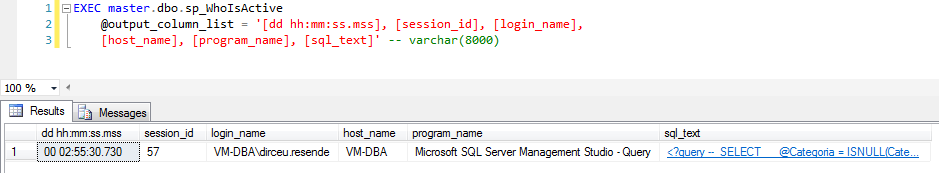
@output_column_list
As I have already demonstrated in some examples above, this parameter is used to define which columns should be part of the final result of the SP execution.
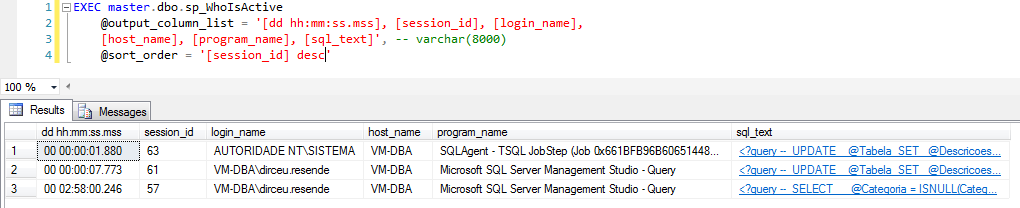
@sort_order
As the name suggests, this parameter is used to order the results according to your needs, where you choose which columns to use for sorting and what the criteria are (asc or desc).
@format_output
This parameter is used to change the way some columns are displayed to a more “human” reading mode. With a value of 1, the output format will use variable length fonts. With a value of 2, the output format will use fixed-length fonts.
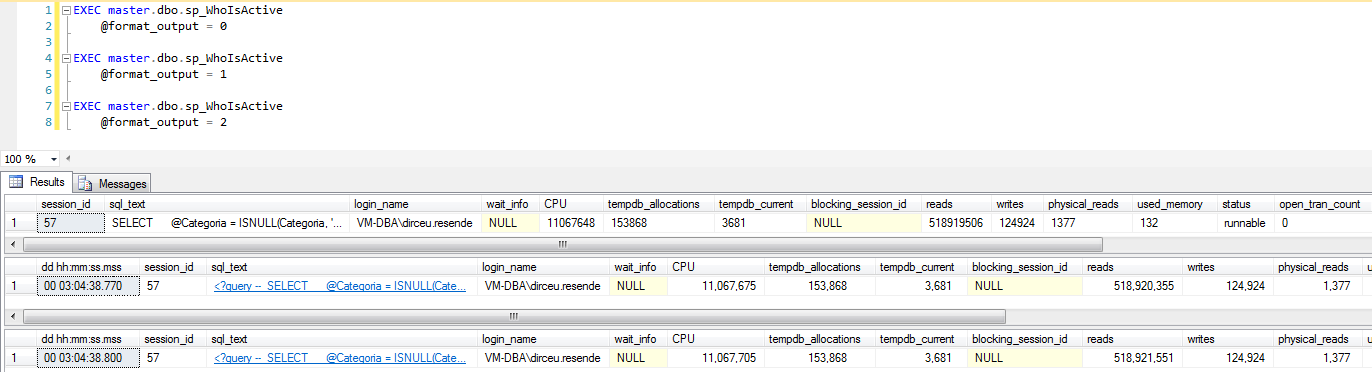
To be honest, I see differences between the value 0 and 1, but I don't see differences between the values 1 and 2.
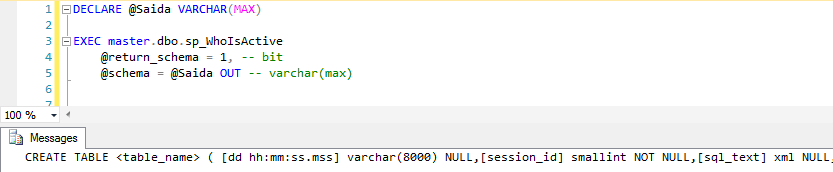
@return_schema and @schema
These parameters together serve to generate the SP result creation script. The @return_schema parameter, when set to 1, instead of returning the execution result, generates the CREATE TABLE script for the result. This script must be read using an OUTPUT variable in the @schema parameter, as shown below:
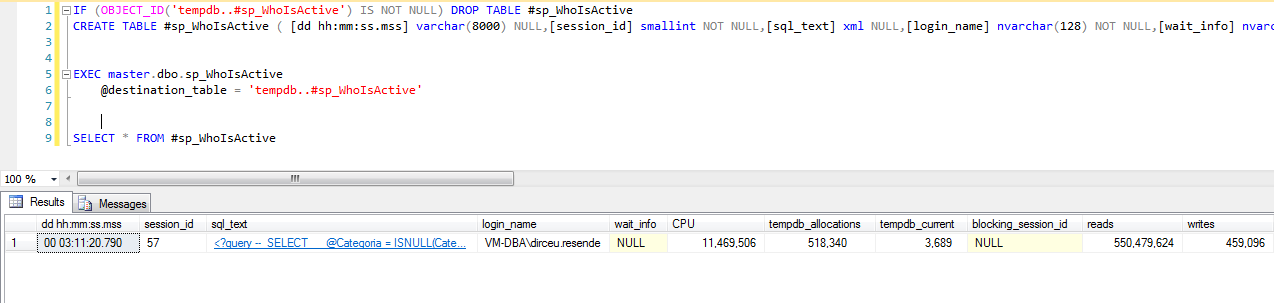
@destination_table
And lastly, we have the @destination_table parameter. It is used to insert the result of the SP execution into a physical table, where we can store history and consult it whenever we want.
To use this parameter, the table must be previously created, as this parameter will only insert the data, it will not create the table. To obtain the CREATE TABLE command resulting from the execution of this SP, just look at the parameters explained above (@return_schema and @schema) to do this easily and in a few seconds.
That's it folks!
I hope this post is useful for you.

Comments (0)
Loading comments...