
A very common need in a database administrator's daily life is to analyze the instance's CPU usage. For this reason, in this article I will share a Transact-SQL (T-SQL) query to obtain this information from a SQL Server 2008+ or Azure SQL Database.
Although it is possible to obtain CPU usage using graphical tools, it is often interesting to be able to access this information using a query, as you can store this history in a table, generate alerts and personalized actions according to the value obtained, create graphs in Power BI, etc...
How to return CPU usage using T-SQL
To return the server's CPU usage using T-SQL, use the script below:
DECLARE @ts_now BIGINT = (
    SELECT
        cpu_ticks / ( cpu_ticks / ms_ticks )
    FROM
        sys.dm_os_sys_info
);

SELECT
    SQLProcessUtilization AS [SQL Server Process CPU Utilization],
    SystemIdle AS [System Idle Process],
    100 - SystemIdle - SQLProcessUtilization AS [Other Process CPU Utilization],
    DATEADD(ms, -1 * ( @ts_now - [timestamp] ), GETDATE()) AS [Event Time]
FROM
(
    SELECT
        record.value('(./Record/@id)[1]', 'int') AS record_id,
        record.value('(./Record/SchedulerMonitorEvent/SystemHealth/SystemIdle)[1]', 'int') AS [SystemIdle],
        record.value('(./Record/SchedulerMonitorEvent/SystemHealth/ProcessUtilization)[1]', 'int') AS [SQLProcessUtilization],
        [timestamp]
    FROM
    (
        SELECT
            [timestamp],
            CONVERT(XML, record) AS [record]
        FROM
            sys.dm_os_ring_buffers
        WHERE
            ring_buffer_type = N'RING_BUFFER_SCHEDULER_MONITOR'
            AND record LIKE N'%<SystemHealth>%'
    ) AS x
) AS y
ORDER BY
    record_id DESC
OPTION ( RECOMPILE );
Return example:
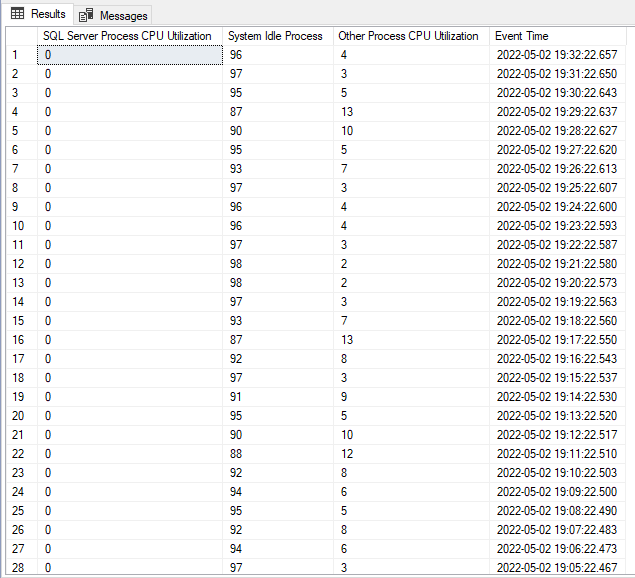
The script above uses the DMV sys.dm_os_ring_buffers and the Extended Event “SystemHealth”, enabled by default. You don't need to activate anything to use this script and it always returns the CPU usage for the last 256 minutes (a little over 4 hours). If the instance is restarted, this data will be lost.
This script has been tested on Azure SQL Database and SQL Server 2008 and 2019.
How to return Memory usage using T-SQL
To return the server's Memory usage using T-SQL, use the script below. With it, it is possible to identify whether there is memory pressure and whether it is being caused by the OS or by SQL Server itself.
The first point that should be noted is the “RmNotification” column, which tells us the type of notification generated:
- RESOURCE_MEMPHYSICAL_HIGH – SQL has room to allocate more memory
- RESOURCE_MEMPHYSICAL_LOW – Internal or system physical memory low
- RESOURCE_MEM_STEADY
- RESOURCE_MEMVIRTUAL_LOW – Virtual address range for SQL Server is running out
If the “RmNotification” column displays a “RESOURCE_MEMPHYSICAL_LOW” message, it means that memory was low and this generated this alert in Ring Buffer.
To understand what was low, let's look at the “IndicatorsProcess” and “IndicatorsSystem” columns.
If the “IndicatorsProcess” column returns 0 and the “IndicatorsSystem” column returns a value other than 0, it means that the memory pressure problem has affected the entire system. But if the opposite happens, it means that only one process suffered memory pressure and not the entire system (but it doesn't say which process it was).
Possible values for the “IndicatorsProcess” and “IndicatorsSystem” columns:
- IDX_MEMPHYSICAL_HIGH (High Physical Memory) = 1
- IDX_MEMPHYSICAL_LOW (Low Physical Memory) = 2
- IDX_MEMVIRTUALL_LOW (Low Virtual Memory) = 4
-- https://blogs.msdn.microsoft.com/mvpawardprogram/2012/06/04/using-sys-dm_os_ring_buffers-to-diagnose-memory-issues-in-sql-server/
WITH RingBuffer AS (
    SELECT
        CAST(dorb.record AS XML) AS xRecord,
        dorb.[timestamp]
    FROM
        sys.dm_os_ring_buffers AS dorb
    WHERE
        dorb.ring_buffer_type = 'RING_BUFFER_RESOURCE_MONITOR'
)
SELECT
    xr.value('(ResourceMonitor/Notification)[1]', 'varchar(75)') AS RmNotification,
    DATEADD (ss, (-1 * ((B.cpu_ticks / CONVERT (FLOAT, (B.cpu_ticks/ B.ms_ticks))) - A.[timestamp]) / 1000), GETDATE()) AS RmDateTime,
    xr.value('(ResourceMonitor/IndicatorsProcess)[1]', 'tinyint') AS IndicatorsProcess,
    xr.value('(ResourceMonitor/IndicatorsSystem)[1]', 'tinyint') AS IndicatorsSystem,
    xr.value('(MemoryNode/TargetMemory)[1]', 'bigint') AS TargetMemory,
    xr.value('(MemoryNode/ReserveMemory)[1]', 'bigint') AS ReserveMemory,
    xr.value('(MemoryNode/CommittedMemory)[1]', 'bigint') AS CommitedMemory,
    xr.value('(MemoryNode/SharedMemory)[1]', 'bigint') AS SharedMemory,
    xr.value('(MemoryNode/PagesMemory)[1]', 'bigint') AS PagesMemory,
    xr.value('(MemoryRecord/MemoryUtilization)[1]', 'bigint') AS MemoryUtilization,
    xr.value('(MemoryRecord/TotalPhysicalMemory)[1]', 'bigint') AS TotalPhysicalMemory,
    xr.value('(MemoryRecord/AvailablePhysicalMemory)[1]', 'bigint') AS AvailablePhysicalMemory,
    xr.value('(MemoryRecord/TotalPageFile)[1]', 'bigint') AS TotalPageFile,
    xr.value('(MemoryRecord/AvailablePageFile)[1]', 'bigint') AS AvailablePageFile,
    xr.value('(MemoryRecord/TotalVirtualAddressSpace)[1]', 'bigint') AS TotalVirtualAddressSpace,
    xr.value('(MemoryRecord/AvailableVirtualAddressSpace)[1]', 'bigint') AS AvailableVirtualAddressSpace,
    xr.value('(MemoryRecord/AvailableExtendedVirtualAddressSpace)[1]', 'bigint') AS AvailableExtendedVirtualAddressSpace
FROM
    RingBuffer AS A
    CROSS APPLY A.xRecord.nodes('Record') record(xr)
    CROSS JOIN sys.dm_os_sys_info AS B
Example result:

If you need a simpler query, you can also use the “dm_os_process_memory” DMV:
SELECT *
FROM sys.dm_os_process_memory
Result:

I had already shared these scripts above in the article SQL Server – Useful day-to-day DBA queries that you always have to look for on the Internet, but most people ended up not finding it when they needed it and that's why I decided to create this article.
I hope you liked this post.
A big hug and see you later!

Comments (0)
Loading comments...