Hey guys!
The topic of today's post is timeout, which consists of a time limit (generally measured in seconds) in which an operation will wait until it forcefully terminates execution, if this time limit is reached.
The objective of this post is to show how to identify timeouts or interrupted connections using Extended Events (XE) or SQL Profiler (Trace) and facilitate the analysis of this type of problem that is so common in everyday life.
After identifying the root cause of the timeout, the solution to resolve this is to try to optimize queries through Performance Tuning techniques to reduce execution time. Depending on the process, if it really is something that involves a lot of processing and it really takes a long time, it is worth increasing the timeout time for that specific process, but that is a subject for my series of Performance Tuning in SQL Server.
In SQL Server, we have several types of timeouts, where I would like to highlight:
- Remote Query Timeout (sp_configure), which defines the maximum time that remote queries (using linked server) can be executed (default time: 600 seconds)
- lock_timeout (SET command), which is the time that the client executing an SQL command will wait for a lock to be released to continue executing that command (default time: -1 = infinite = will wait indefinitely)
- Command Timeout is a property of database connection drivers, such as ADO.NET, JDBC and others, that allows you to define a maximum time limit that an SQL statement can execute in the database. This value can be changed dynamically in the application, and may have different timeouts, depending on the context. (default time: 30 seconds)
- Connection Timeout is a property of connection string which allows you to set a maximum time limit that the connection driver will wait to establish a connection to the database (default time: 30 seconds)
It is very important to make it clear that the lock_timeout, Command Timeout and Connection Timeout timeouts These are limits imposed by the client/connection driver and not by the database.
When a timeout occurs, it will generate an exception in the application, but from the database's point of view, there was no error or problem in execution (or connection), precisely because the timeout does not occur in the database, i.e. It is not the bank that is interrupting the SQL statement, but the application.
If you want to know more about SQL Server SET commands, access the article SQL Server SET commands.
I also recommend reading my article Timeout when executing Queries via Linked Server in SQL Server, if you are facing any problem related to this.
We also cannot forget the timeout of the development tool (IDE) that the DBA or developer uses to access the database.
SQL Server Management Studio (SSMS), for example, has a property called “Execution time-out”, which defines how long SSMS should wait to execute a query (internally, this is the connection driver's Command Timeout property).
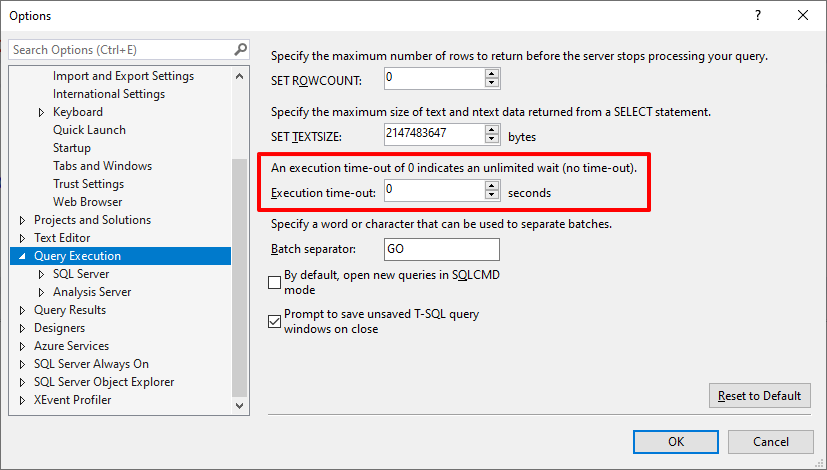
The default value of this property in SSMS is 0 (infinity), that is, it has no time limit.
How to generate a timeout using SQLCMD
In order to create some test records and demonstrate how to identify timeouts in the database, I will force timeouts to occur in the database.
To do this, I will use the SQLCMD utility and the property -t 1 (query timeout of 1 second), and I will use the command WAITFOR DELAY ’00:00:05′, which waits for 5 seconds, that is, whenever I execute this command, I will generate a timeout event.
Execution result:
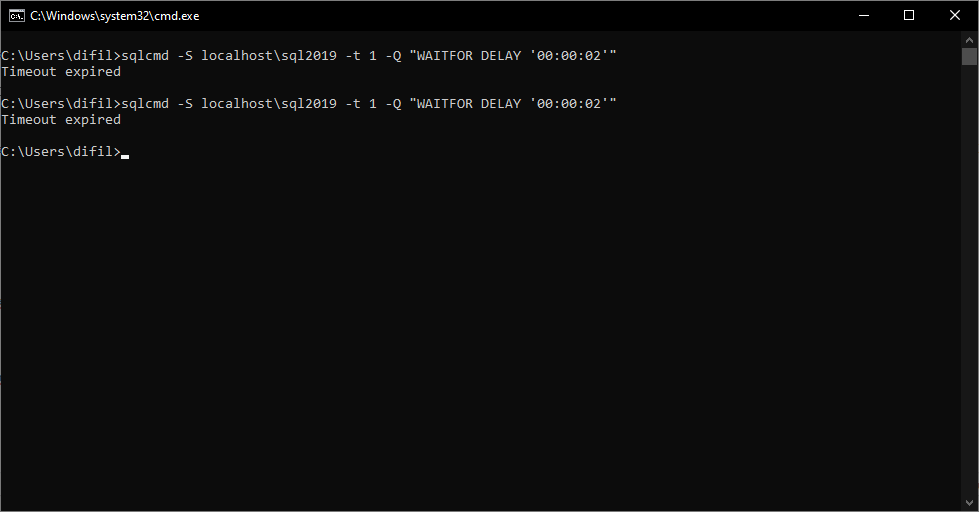
Generated timeouts.
How to identify timeouts in the database using Extended Events (XE)
To identify timeouts in the database, I've seen many people using the query execution time to define whether there was a timeout or not. As the default is 30 seconds, the person assumes that if the query took exactly 30 seconds, it is because a timeout occurred. However, this is not always true, because, as I mentioned at the beginning of the post, for each context or system screen, the developer can define different timeout times.
One of the ways to identify whether a timeout has actually occurred is by using Extended Events (XE), analyzing the attention event class, available since SQL Server 2012, which indicates that an event has occurred that requires attention, such as cancellations, client stop requests, and loss of client connections. Cancel operations can also be seen as part of implementing driver data access timeouts (timeouts)
I will share the ready-made script to implement monitoring and also screenshots of the Extended Events interface, in case you want to create it yourself, via the screen.
Script to monitor timeout in SQL Server using Extended Events (XE)
-- Apaga a sessão, caso ela já exista
IF ((SELECT COUNT(*) FROM sys.server_event_sessions WHERE [name] = 'Monitora Timeouts') > 0) DROP EVENT SESSION [Monitora Timeouts] ON SERVER
GO

CREATE EVENT SESSION [Monitora Timeouts]
ON SERVER
ADD EVENT sqlserver.attention (
    ACTION
    (
        sqlserver.client_app_name,
        sqlserver.client_hostname,
        sqlserver.[database_name],
        sqlserver.nt_username,
        sqlserver.num_response_rows,
        sqlserver.server_instance_name,
        sqlserver.server_principal_name,
        sqlserver.server_principal_sid,
        sqlserver.session_id,
        sqlserver.session_nt_username,
        sqlserver.session_server_principal_name,
        sqlserver.sql_text,
        sqlserver.username
    )
)
ADD TARGET package0.event_file (
    SET
        filename = N'D:\SQL\Traces\Monitora_Timeout.xel', -- Não esqueça de mudar o caminho aqui :)
        max_file_size = ( 50 ), -- Tamanho máximo (MB) de cada arquivo
        max_rollover_files = ( 8 ) -- Quantidade de arquivos gerados
)
WITH
(
    STARTUP_STATE = OFF
)

-- Ativando a sessão (por padrão, ela é criada desativada)
ALTER EVENT SESSION [Monitora Timeouts] ON SERVER STATE = START
GO
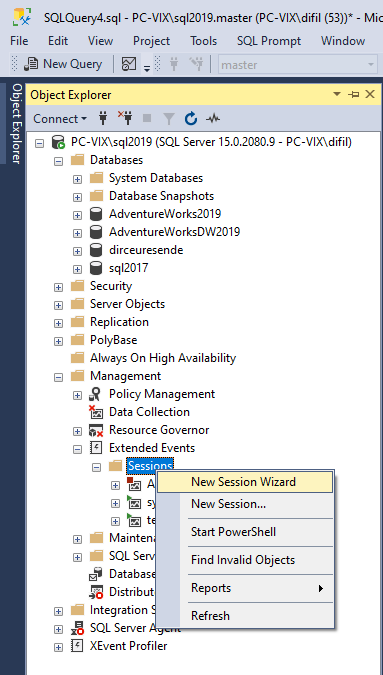
Interface for monitoring timeout in SQL Server using Extended Events (XE)
Click to view screenshots
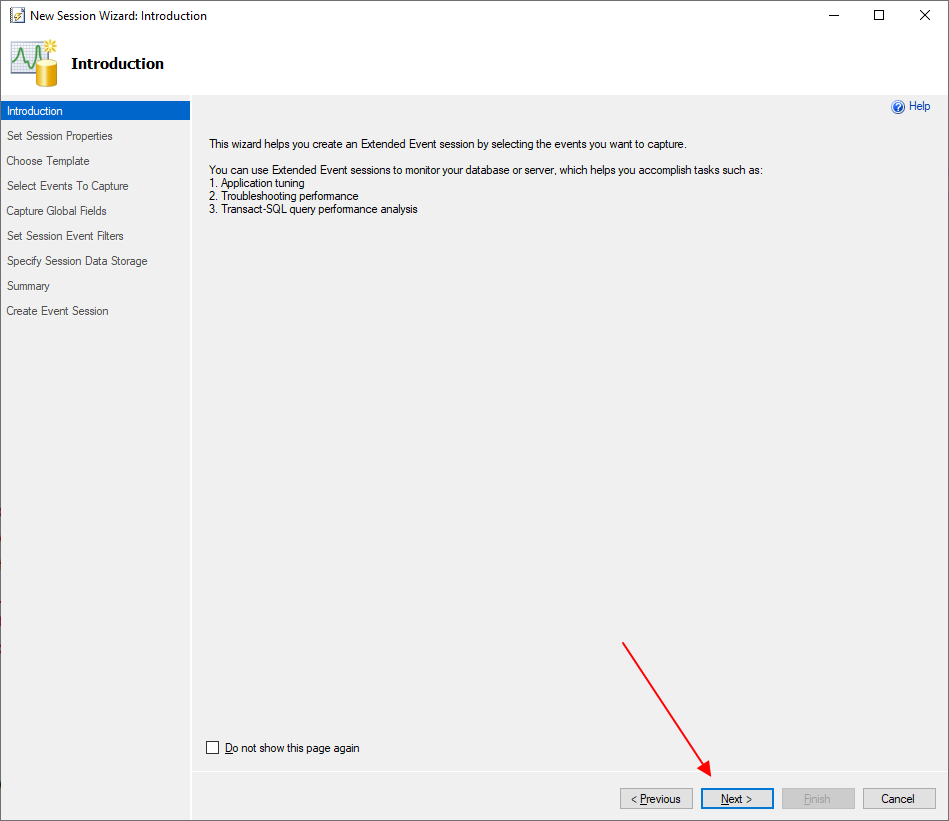
Screenshot 1 – Open the XE Wizard through the SSMS Object Explorer
Screenshot 2 – Home screen
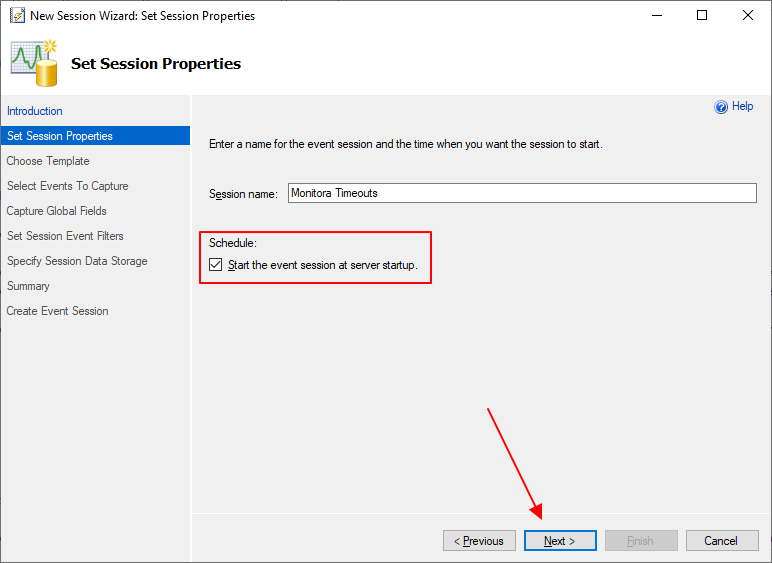
Screenshot 3 – Define the name of the Extended Event and check the box to enable the event at the end of the configuration
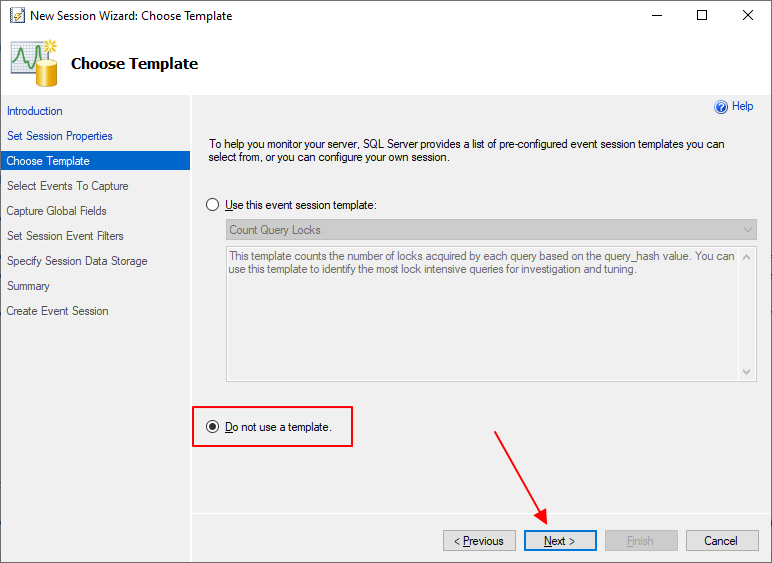
Screenshot 4 – Mark that I don't want to use any template
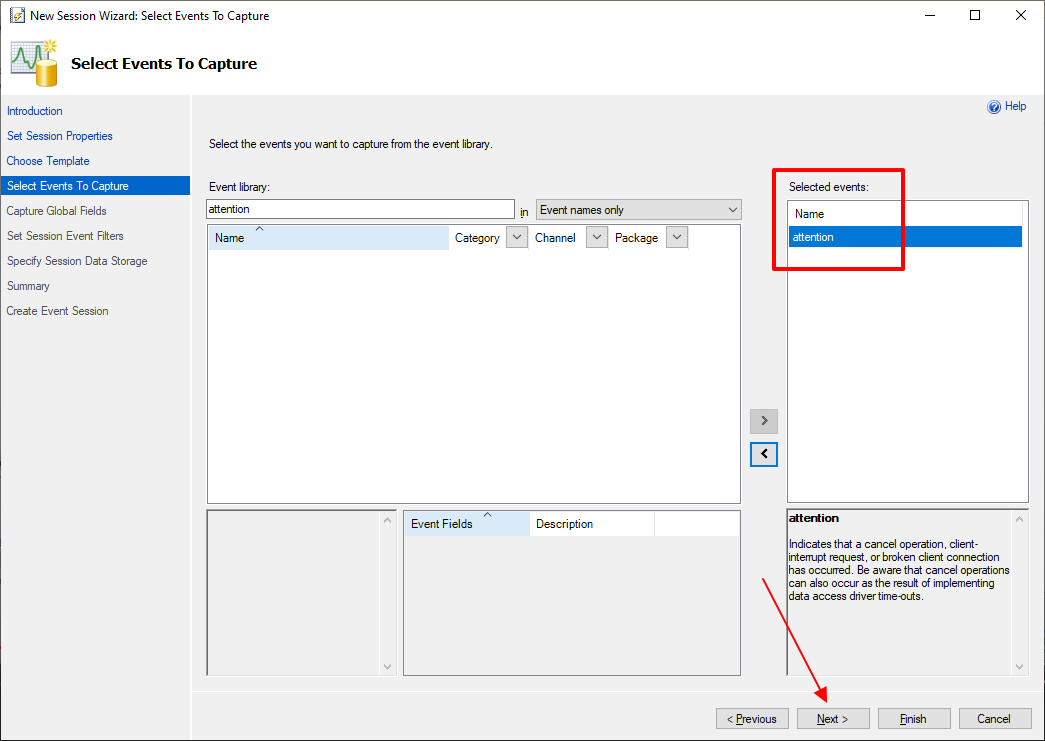
Screenshot 5 – Select the “attention” event and add it to the list of selected events
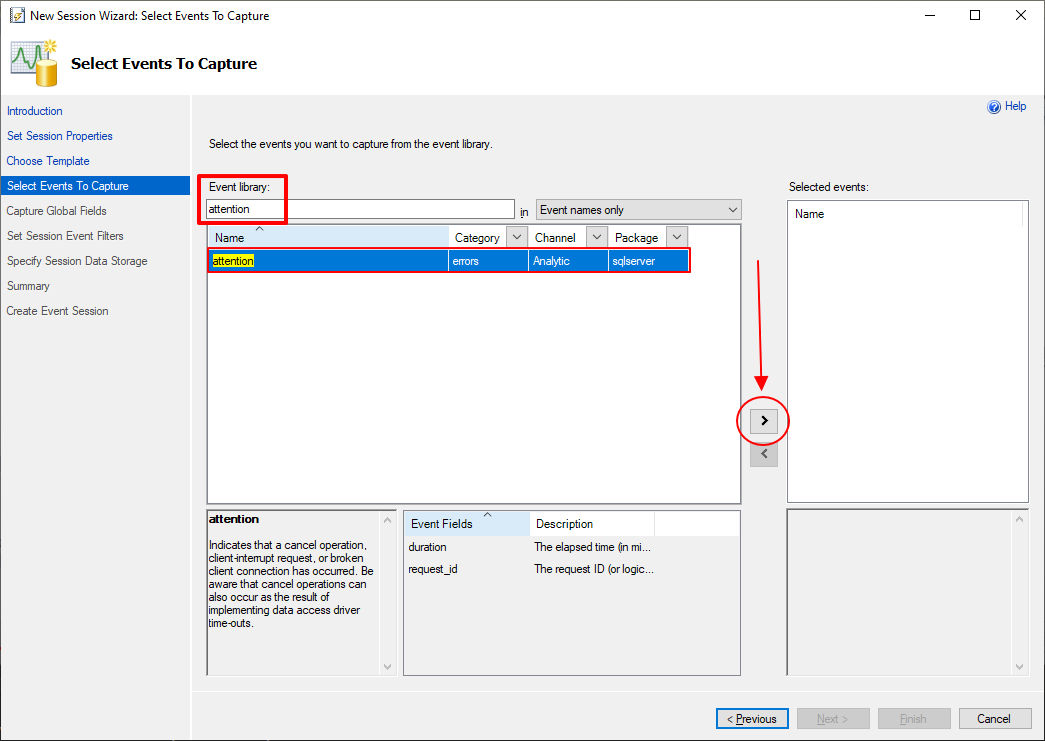
Screenshot 6 – Confirm selection and proceed to the next screen
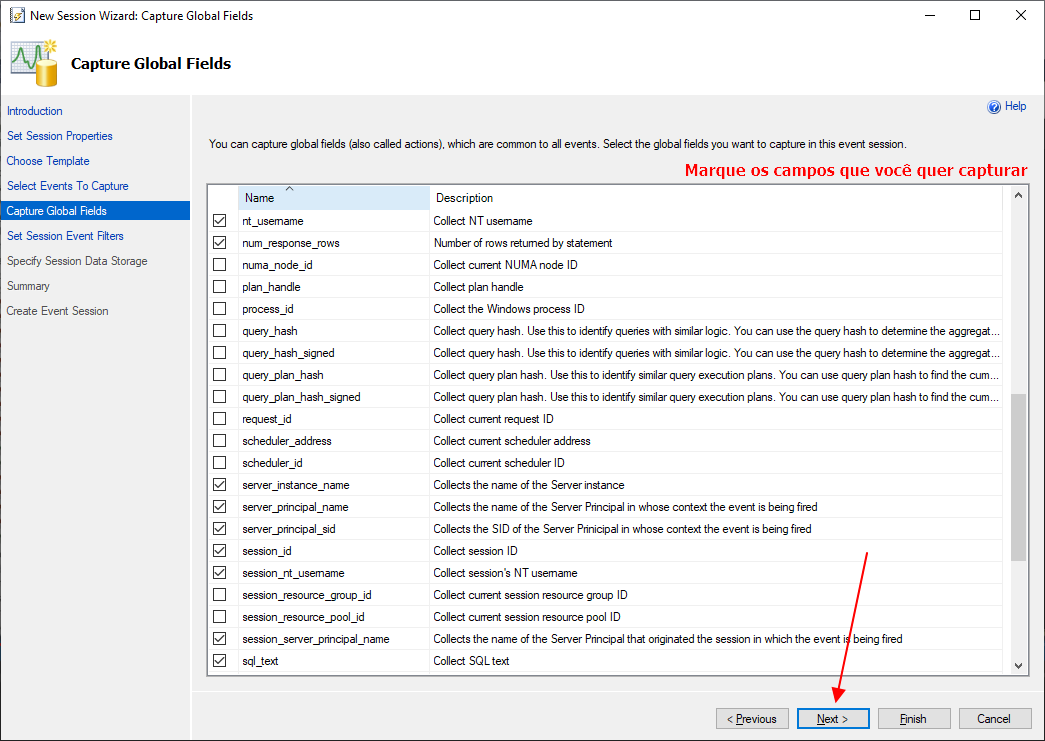
Screenshot 7 – Select the return fields you want the event to return
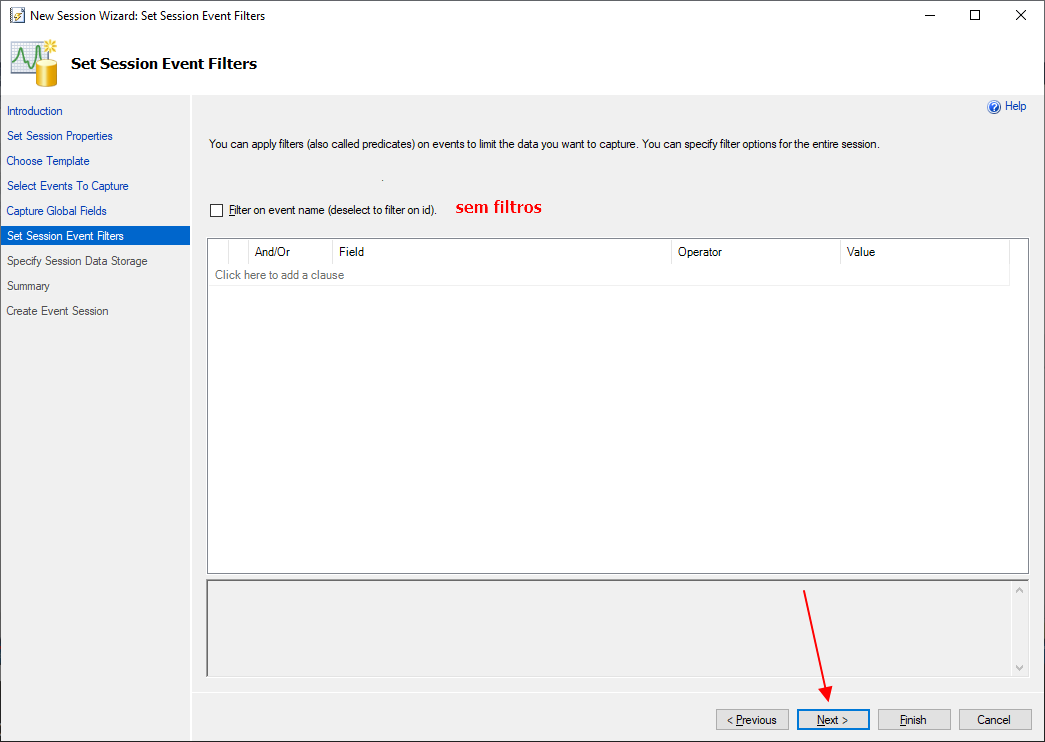
Screenshot 8 – Advance without applying filters
Screenshot 9 – Define the location to save the .xel file, maximum size and file rollover

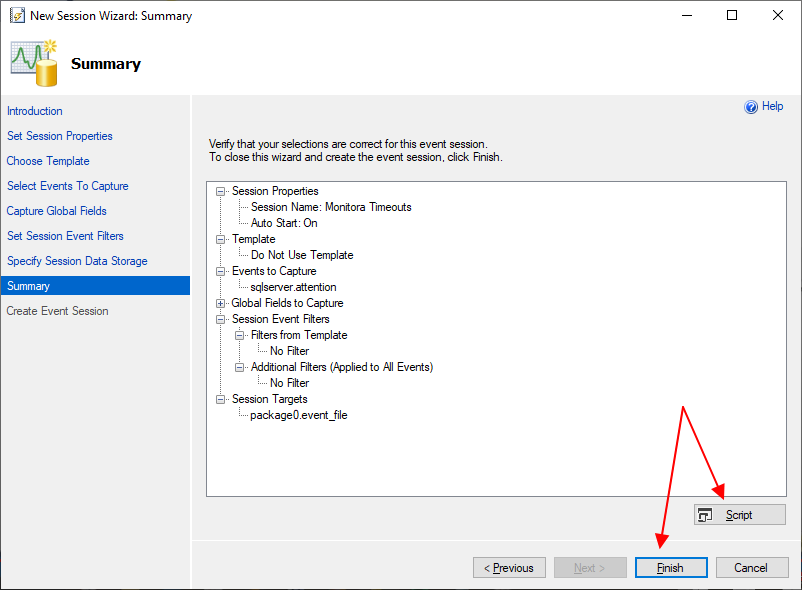
Screenshot 10 – Final screen and summary of operations
Script to read data written by Extended Event (XE)
Click to view the script
IF (OBJECT_ID('dbo.Historico_Timeout') IS NULL)
BEGIN

    -- DROP TABLE dbo.Historico_Timeout
    CREATE TABLE dbo.Historico_Timeout (
        [Dt_Evento]            DATETIME,
        [session_id]           INT,
        [duration]             BIGINT,
        [server_instance_name] VARCHAR(100),
        [database_name]        VARCHAR(100),
        [session_nt_username]  VARCHAR(100),
        [nt_username]          VARCHAR(100),
        [client_hostname]      VARCHAR(100),
        [client_app_name]      VARCHAR(100),
        [num_response_rows]    INT,
        [sql_text]             XML
    ) WITH(DATA_COMPRESSION=PAGE)

END


DECLARE @TimeZone INT = DATEDIFF(HOUR, GETUTCDATE(), GETDATE())
DECLARE @Dt_Ultimo_Evento DATETIME = ISNULL((SELECT MAX(Dt_Evento) FROM dbo.Historico_Timeout WITH(NOLOCK)), '1990-01-01')


IF (OBJECT_ID('tempdb..#Eventos') IS NOT NULL) DROP TABLE #Eventos
;WITH CTE AS (
    SELECT CONVERT(XML, event_data) AS event_data
    FROM sys.fn_xe_file_target_read_file(N'D:\SQL\Traces\Monitora_Timeout*.xel', NULL, NULL, NULL)
)
SELECT
    DATEADD(HOUR, @TimeZone, CTE.event_data.value('(//event/@timestamp)[1]', 'datetime')) AS Dt_Evento,
    CTE.event_data
INTO
    #Eventos
FROM
    CTE
WHERE
    DATEADD(HOUR, @TimeZone, CTE.event_data.value('(//event/@timestamp)[1]', 'datetime')) > @Dt_Ultimo_Evento


INSERT INTO dbo.Historico_Timeout
SELECT
    A.Dt_Evento,
    xed.event_data.value('(action[@name="session_id"]/value)[1]', 'int') AS [session_id],
    xed.event_data.value('(data[@name="duration"]/value)[1]', 'bigint') AS [duration],
    xed.event_data.value('(action[@name="server_instance_name"]/value)[1]', 'varchar(100)') AS [server_instance_name],
    xed.event_data.value('(action[@name="database_name"]/value)[1]', 'varchar(100)') AS [database_name],
    xed.event_data.value('(action[@name="session_nt_username"]/value)[1]', 'varchar(100)') AS [session_nt_username],
    xed.event_data.value('(action[@name="nt_username"]/value)[1]', 'varchar(100)') AS [nt_username],
    xed.event_data.value('(action[@name="client_hostname"]/value)[1]', 'varchar(100)') AS [client_hostname],
    xed.event_data.value('(action[@name="client_app_name"]/value)[1]', 'varchar(100)') AS [client_app_name],
    xed.event_data.value('(action[@name="num_response_rows"]/value)[1]', 'int') AS [num_response_rows],
    TRY_CAST(xed.event_data.value('(action[@name="sql_text"]/value)[1]', 'varchar(max)') AS XML) AS [sql_text]
FROM
    #Eventos A
    CROSS APPLY A.event_data.nodes('//event') AS xed (event_data)
Example of returned data:

- SQL Server – How to identify deprecated features being used in the instance (Extended Events – XE)
- SQL Server – How to generate a deadlock history to analyze failures in routines
- SQL Server – How to create error and exception monitoring in your database using Extended Events (XE)
- SQL Server – How to identify and collect information from long-running queries using Extended Events (XE)
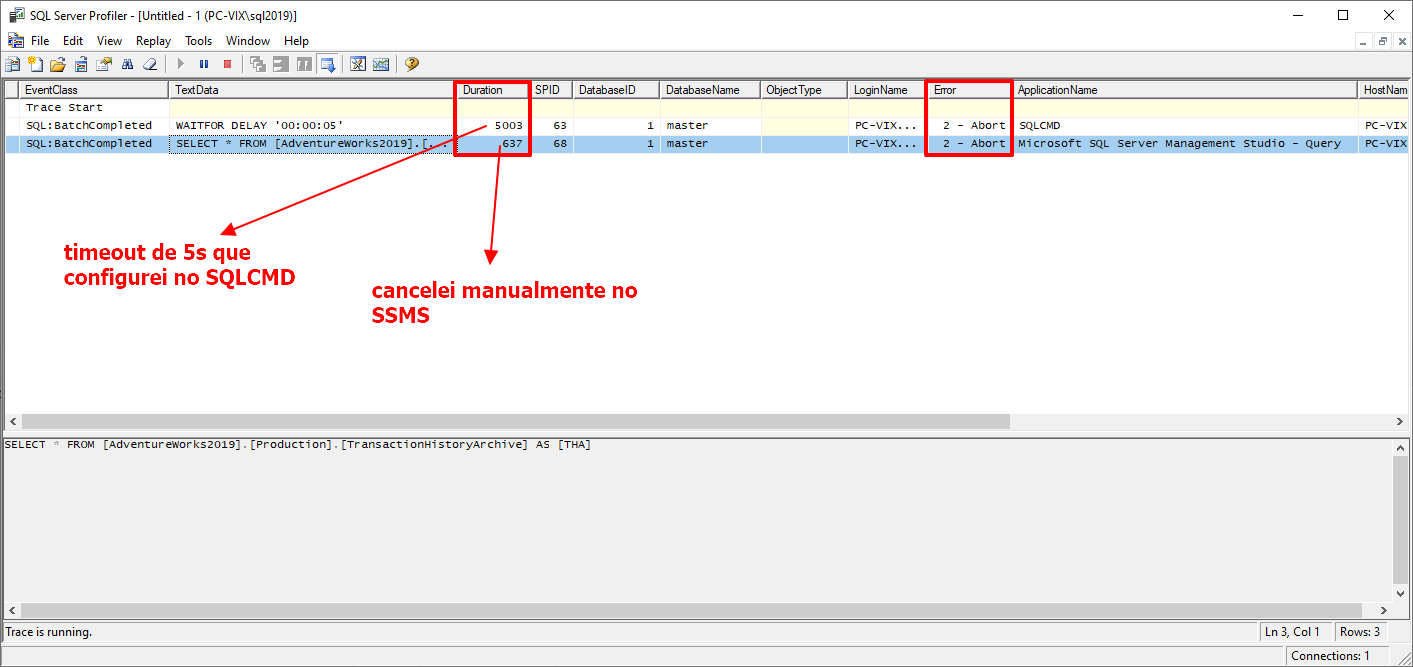
How to identify timeouts in the database using SQL Profiler (Trace)
Another way to identify timeouts in the database is using SQL Profiler (Trace), especially if you are using a version prior to 2012, which does not support the Extended Events attention event.
To achieve this goal with SQL Profiler, we will monitor the RPC:Completed, SP:StmtCompleted, and SQL:BatchCompleted events and filter only the results that meet the Error = 2 filter.
Even applying this filter, you must closely monitor whether your server's workload will increase significantly after activating this trace, because everything that is executed will be analyzed by this trace.
Whenever possible, try to use Extended Events (XE) instead of Profiler (Trace), especially for this situation.
Script to monitor timeout in SQL Server using SQL Profiler (Trace)
--------------------------------------------------------
-- Armazena os resultados do Trace na tabela
--------------------------------------------------------

DECLARE @Trace_Id INT, @Path VARCHAR(MAX)

SELECT
    @Trace_Id = id,
    @Path = [path]
FROM
    sys.traces
WHERE
    [path] LIKE '%Monitora_Timeout.trc'


IF (@Trace_Id IS NOT NULL)
BEGIN

    -- Interrompe o rastreamento especificado.
    EXEC sys.sp_trace_setstatus
        @Trace_Id = @Trace_Id,
        @status = 0


    -- Fecha o rastreamento especificado e exclui sua definição do servidor.
    EXEC sys.sp_trace_setstatus
        @Trace_Id = @Trace_Id,
        @status = 2


    IF (OBJECT_ID('dbo.Historico_Timeout') IS NULL)
    BEGIN

        -- DROP TABLE dbo.Historico_Timeout
        CREATE TABLE [dbo].[Historico_Timeout] (
            [TextData]        VARCHAR(MAX),
            [NTUserName]      NVARCHAR(256),
            [HostName]        NVARCHAR(256),
            [ApplicationName] NVARCHAR(256),
            [LoginName]       NVARCHAR(256),
            [Duration]        DECIMAL(15, 2),
            [StartTime]       DATETIME,
            [EndTime]         DATETIME,
            [ServerName]      NVARCHAR(256),
            [DatabaseName]    NVARCHAR(256)
        )
        WITH ( DATA_COMPRESSION = PAGE )

        CREATE CLUSTERED INDEX [SK01_Traces] ON [dbo].[Historico_Timeout] ([StartTime]) WITH (FILLFACTOR=80, STATISTICS_NORECOMPUTE=ON, DATA_COMPRESSION = PAGE)

    END


    INSERT INTO dbo.Historico_Timeout (
        TextData,
        NTUserName,
        HostName,
        ApplicationName,
        LoginName,
        Duration,
        StartTime,
        EndTime,
        ServerName,
        DatabaseName
    )
    SELECT
        TextData,
        NTUserName,
        HostName,
        ApplicationName,
        LoginName,
        CAST(Duration / 1000 / 1000.00 AS NUMERIC(15, 2)) Duration,
        StartTime,
        DATEADD(MILLISECOND, Duration / 1000, StartTime) AS EndTime,
        ServerName,
        DatabaseName
    FROM
        ::fn_trace_gettable(@Path, DEFAULT)
    WHERE
        ApplicationName NOT LIKE '%Management Studio%'
        AND Error = 2 -- Abort
    ORDER BY
        StartTime


    --------------------------------------------------------
    -- Apaga o arquivo de trace
    --------------------------------------------------------

    DECLARE @Fl_Xp_CmdShell_Ativado BIT = (SELECT (CASE WHEN CAST([value] AS VARCHAR(MAX)) = '1' THEN 1 ELSE 0 END) FROM sys.configurations WHERE [name] = 'xp_cmdshell')

    IF (@Fl_Xp_CmdShell_Ativado = 0)
    BEGIN

        EXECUTE sp_configure 'show advanced options', 1;
        RECONFIGURE WITH OVERRIDE;

        EXEC sp_configure 'xp_cmdshell', 1;
        RECONFIGURE WITH OVERRIDE;

    END


    DECLARE @Cmd VARCHAR(4000) = 'del ' + @Path + ' /Q'
    EXEC sys.xp_cmdshell @Cmd


    IF (@Fl_Xp_CmdShell_Ativado = 0)
    BEGIN

        EXEC sp_configure 'xp_cmdshell', 0;
        RECONFIGURE WITH OVERRIDE;

        EXECUTE sp_configure 'show advanced options', 0;
        RECONFIGURE WITH OVERRIDE;

    END


END


--------------------------------------------------------
-- Ativa o trace novamenmte
--------------------------------------------------------

DECLARE
    @rc INT,
    @TraceID INT,
    @maxfilesize BIGINT = 50,
    @on BIT = 1

EXEC @rc = sp_trace_create @TraceID OUTPUT, 0, N'D:\SQL\Traces\Monitora_Timeout', @maxfilesize, NULL

IF (@rc = 0)
BEGIN

    exec sp_trace_setevent @TraceID, 10, 1, @on
    exec sp_trace_setevent @TraceID, 10, 10, @on
    exec sp_trace_setevent @TraceID, 10, 3, @on
    exec sp_trace_setevent @TraceID, 10, 6, @on
    exec sp_trace_setevent @TraceID, 10, 8, @on
    exec sp_trace_setevent @TraceID, 10, 11, @on
    exec sp_trace_setevent @TraceID, 10, 12, @on
    exec sp_trace_setevent @TraceID, 10, 13, @on
    exec sp_trace_setevent @TraceID, 10, 14, @on
    exec sp_trace_setevent @TraceID, 10, 31, @on
    exec sp_trace_setevent @TraceID, 10, 34, @on
    exec sp_trace_setevent @TraceID, 10, 35, @on
    exec sp_trace_setevent @TraceID, 10, 60, @on
    exec sp_trace_setevent @TraceID, 45, 1, @on
    exec sp_trace_setevent @TraceID, 45, 3, @on
    exec sp_trace_setevent @TraceID, 45, 6, @on
    exec sp_trace_setevent @TraceID, 45, 8, @on
    exec sp_trace_setevent @TraceID, 45, 10, @on
    exec sp_trace_setevent @TraceID, 45, 11, @on
    exec sp_trace_setevent @TraceID, 45, 12, @on
    exec sp_trace_setevent @TraceID, 45, 13, @on
    exec sp_trace_setevent @TraceID, 45, 14, @on
    exec sp_trace_setevent @TraceID, 45, 28, @on
    exec sp_trace_setevent @TraceID, 45, 34, @on
    exec sp_trace_setevent @TraceID, 45, 35, @on
    exec sp_trace_setevent @TraceID, 45, 60, @on
    exec sp_trace_setevent @TraceID, 12, 1, @on
    exec sp_trace_setevent @TraceID, 12, 3, @on
    exec sp_trace_setevent @TraceID, 12, 11, @on
    exec sp_trace_setevent @TraceID, 12, 6, @on
    exec sp_trace_setevent @TraceID, 12, 8, @on
    exec sp_trace_setevent @TraceID, 12, 10, @on
    exec sp_trace_setevent @TraceID, 12, 12, @on
    exec sp_trace_setevent @TraceID, 12, 13, @on
    exec sp_trace_setevent @TraceID, 12, 14, @on
    exec sp_trace_setevent @TraceID, 12, 31, @on
    exec sp_trace_setevent @TraceID, 12, 35, @on
    exec sp_trace_setevent @TraceID, 12, 60, @on


    -- Inclui os filtros
    declare @intfilter int
    declare @bigintfilter bigint

    set @intfilter = 2
    exec sp_trace_setfilter @TraceID, 31, 0, 0, @intfilter

    set @intfilter = NULL
    exec sp_trace_setfilter @TraceID, 31, 0, 1, @intfilter

    -- Ativa o trace
    exec sp_trace_setstatus @TraceID, 1

END
Interface to monitor timeout in SQL Server using SQL Profiler (Trace)
Click to view screenshots
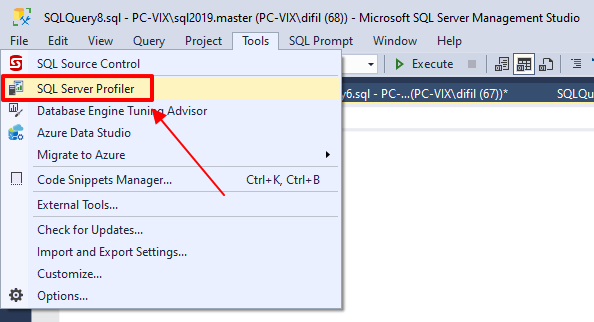
Screenshot 1 – Opening SQL Profiler
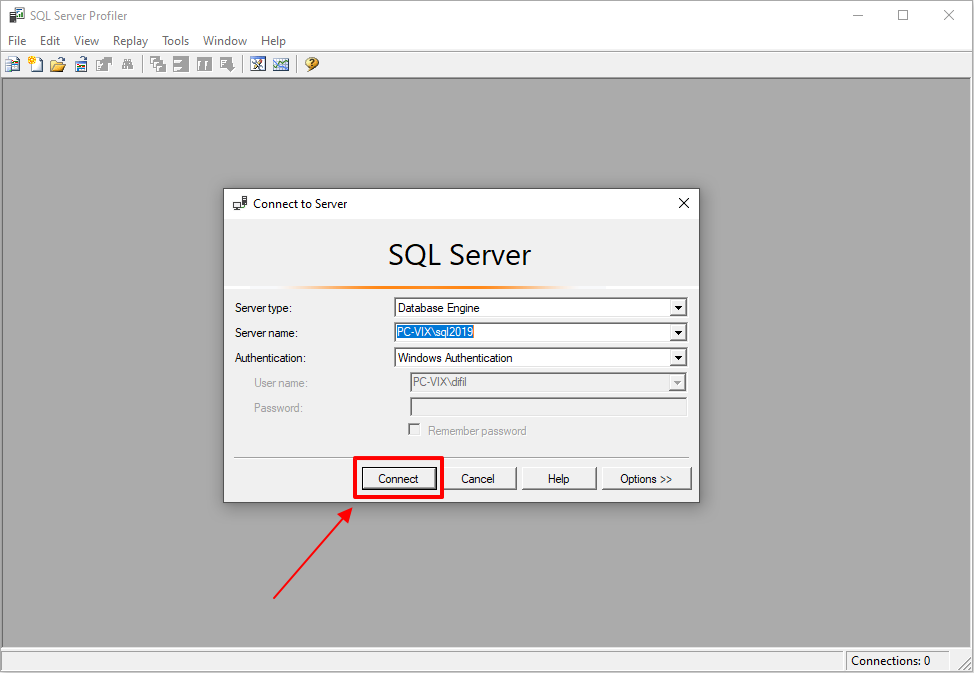
Screenshot 2 – Connecting to the database
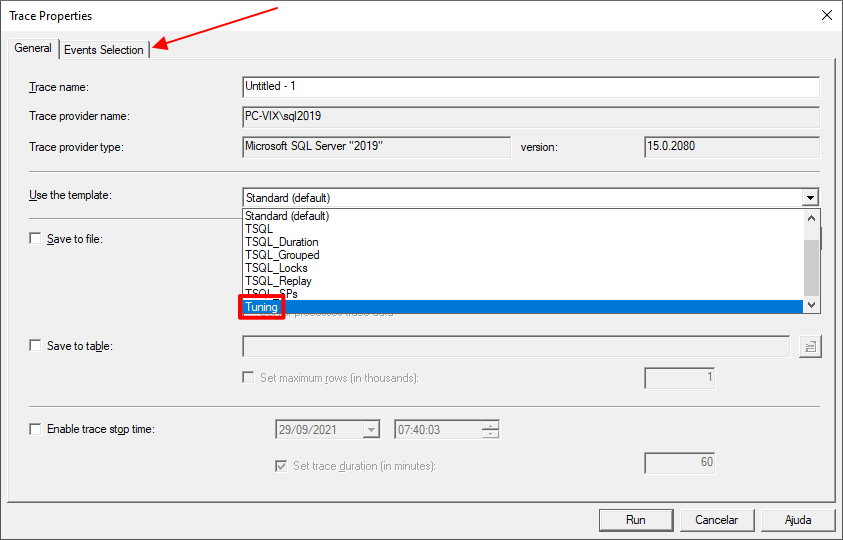
Screenshot 3 – Select the Tuning template and click on the “Event Selection” tab
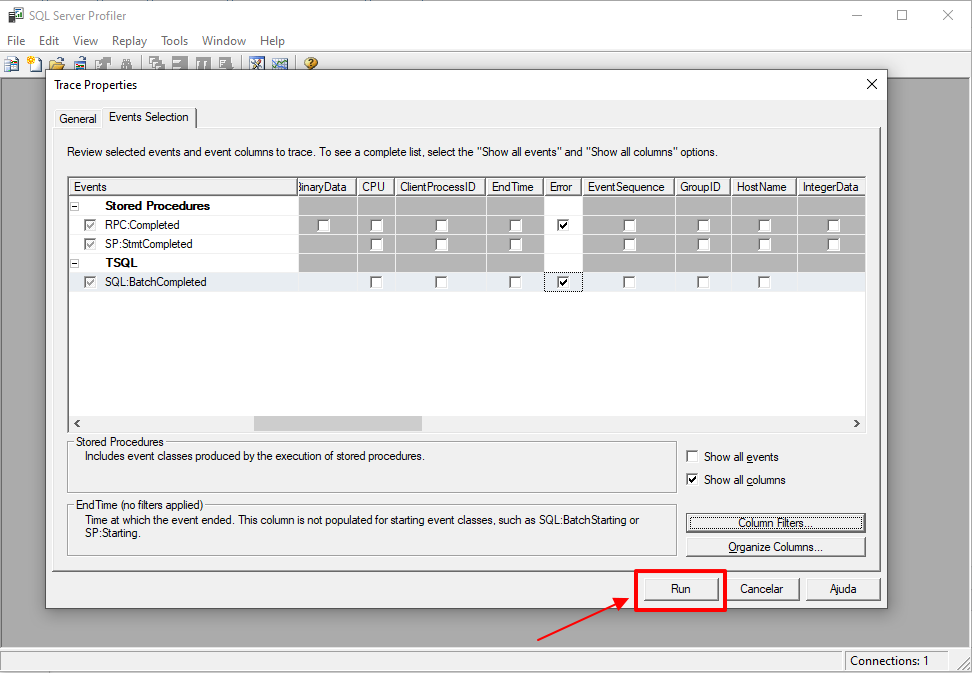
Screenshot 4 – Check the “Show all columns” checkbox, select the “Error” column (and any others you want to return) and click the “Column Filters” button

Screenshot 5 – Apply a filter to the Error column and use the measurement Error = 2. Check the “Exclude rows that do not contain values” checkbox

Screenshot 6 – Click on the Run button to start the trace on the server
Screenshot 7 – Analyze the results found
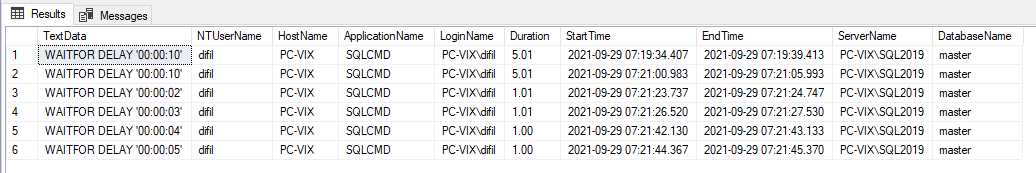
Screenshot 8 – Results collected and already stored in a history table
- SQL Server – How to identify and collect information from long-running queries using Trace (SQL Server Profiler)
- SQL Server – How to audit permission errors on objects using SQL Profiler (Trace)
- Using the standard SQL Server trace to audit events (fn_trace_gettable)
- Monitoring DDL and DCL operations using SQL Server's fn_trace_gettable
Excerpt from a live where the Márcio Junior demonstrates how to identify timeout in SQL Server
And that's it, folks!
A big hug and see you later.

Comments (0)
Loading comments...