
Hey guys!
In this post I will comment on an alerting and monitoring system for SQL Server and Azure Managed Instance, developed by the company PowerTuning, which aims to provide various metrics, analyzes and information to quickly identify the current state of the database (Health Check), send email alerts (including graphs) when an event occurs in the database and monitor changes in the database's behavior, growth of tables, data files and much more.
I've already used other monitoring and alerting systems such as Redgate SQL Monitor and SolarWinds SQL Database Monitoring, but PowerAlerts surprised me with the number of alerts available, the level of detail and the differentiated support that PowerTuning provides.
The CEO of PowerTuning and one of the creators of PowerAlerts, Fabrício Lima, said that “Anyone who has SQL Server and doesn’t use PowerAlerts is crazy”. After testing the product a lot, I have to agree with it lol
If you are interested in Power Alerts, contact the Power Tuning commercial team: [email protected]
1) What is Power Alerts?

It is a tool with 62 thousand lines of code in T-SQL (and growing) created from DBA SQL Server to DBA SQL Server with dozens of Alerts to monitor your database and, now, with the graphs feature to facilitate your visualization and understanding of the environment.
Power Alerts is a complement to any monitoring tool because it already returns detailed information with graphics in the email itself (without you having to look at a monitoring screen or log into the environment). Anyone who has a SQL Server will be happy to have these alerts and logs that are generated for the DBA.
In this live, you can see more details about Power Alerts:
There is nothing like this today here in Brazil (or abroad as far as I know).
Dash with customers who have already received Power Alerts:
2) Alerts created
These are the Alerts that are created in the Power Alerts Implementation:

Plus 1: A monthly email is also created with instance information to be used in the event of a disaster as documentation to find out how the instance was before the environment.
This helps to reinstall the environment without the impact of changes (great help in cases of disaster).
Plus 2: Creation of a daily environmental Checklist with graphics to send instance information daily and help analyze and compare information across different periods.
This can be used to have a quick analysis of the environment or to compare the values between two different dates.
3) Example of a FULL Log Alert
This is the alert header that has a lot of useful information:
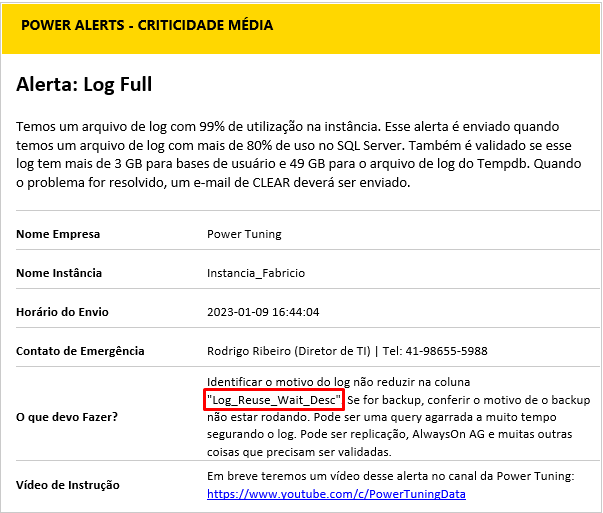
As we can see below, the email itself already shows the reason for the log being stuck (in this case, it is a lack of log backup – “Log Reuse Wait” column with the value “LOG_BACKUP”).
It also shows the disk this log is on and its free space to make you feel more at ease or worried when this alert arrives.
We still have how much this log will grow and whether it is limited (seeing whether it is growing a lot or a little helps a lot).
The first information that the DBA would have to log in and discover in an alert like this is already chewed up in the alert. Productivity and saving DBA hours ($).
Following in the email, we have a graph to make it easier for you to see when the log started to grow and the time it took for it to burst.
Last 60 minutes to see recent log behavior:

Last 48 hours for a longer view of log behavior:

Still in the email, we have a graph to make it easier to see how the disk where this log file is being consumed. Whether it's ending quickly or slowly. No log alert on the internet provides this information.


As one of the common problems may be the lack of backup, the alert also shows when the base log was last backed up with Log FULL:
One less piece of information that the DBA would have to check (more productivity).

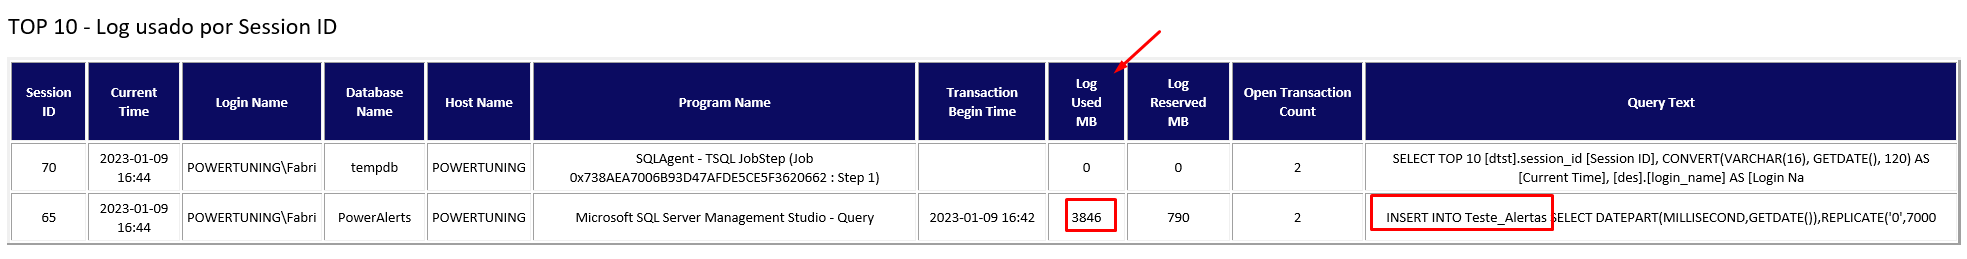
Furthermore, the queries that have an open transaction and are consuming the log are shown so that the DBA can analyze and go after the person responsible to find out whether it can be killed or not:
The DBA would have to find in his scripts which query shows who is consuming the most log and then run it and find out. In Power Alerts, the insert that I placed to fill the Log using 3.8 GB of log has already appeared.
What is running at that moment is still shown with a photo of the whoisactive:
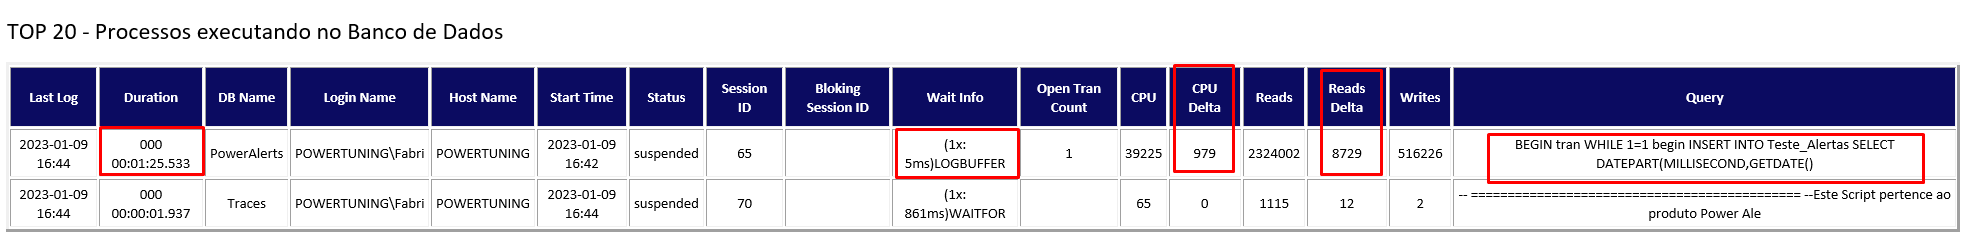
We can see the insert filling the log again.
Finally, we can also see the graph of alerts by day and by hour, helping us to identify the history of this alert.
If I have a lot of alerts coming in per day, we have to try to do something to reduce it:

We can also identify if there is a time of day that generates the most alerts to help find the culprit routine:

At the end of the email there is the logo and our alert registration information:
This is a product licensed by Power Tuning at INPI (National Institute of Industrial Property), under number 512022002100-5, and cannot be shared or used without a purchase contract or prior authorization.
4) DBA routines created
Far beyond the pretty graphics, our alert system also creates more than 25 routines that store data in tables and help the DBA to monitor and act more efficiently in the environment. These routines are used by Power Alerts to send emails and graphics.
DBA routines that are created in the environment (+25 routines):
- Routine to monitor Deadlocks.
- Routine to monitor Script errors that occur in databases.
- Routine to monitor the biggest waits in the environment in a given time interval.
- Routine to monitor whether statistics are up to date.
- Routine to monitor queries that are using tempdb.
- Routine to monitor tempdb data file growth.
- Routine to monitor the growth of tables and databases. With this, we can predict the growth of the environment and make new investments only when necessary.
- Routine for monitoring SQL Server counters.
- Routine to monitor the most time-consuming queries in the environment.
- Routine to monitor the environment's memory usage.
- Routine to monitor Login failures.
- Routine to monitor what is running in the environment every minute (whoisactive).
- Routine to monitor the growth of the Databases Log.
- Routine for monitoring job history.
- Routine to monitor the use of environment indexes.
- Routine to monitor index fragmentation.
- Routine to monitor whether Identity columns are overflowing.
- Routine to monitor the I/O pending queue in SQL Server.
- Routine to monitor the response time and use of SQL Server data files and logs.
- Routine to monitor the SQL Server Error Log.
- Routine to monitor disk space.
- Routine to monitor CPU usage.
- Routine to monitor the queries that are using the most CPU.
- Routine to monitor the execution of CheckDB on the bases.
- Routine for monitoring backup history.
- If you have a cluster, routine to monitor the status of the cluster nodes.
- If you have Mirror, routine to monitor the status and performance of the mirror.
- If you have AlwaysOn AG, routine to monitor the status and performance of the AG.
- Routine to delete old data from all logs created.
5) Power Monitor
With all this information stored for Power Alerts, our BI team created a Dash in Power BI to help monitor our customers' banks:

The customer must meet some prerequisites to use Power monitor, such as:
-
- Power BI account
- Data gateway that has access to the trace base
- Installation of apps not listed in appsource must be enabled
6) Power Reports
In addition to greatly improving the core of alerts and including sensational graphics, some reporting procedures (Power Report) were also created to help analyze the environment on a day-to-day basis.
Just enter your email and the start and end date parameters to obtain the desired information (when applicable).
Real example of using Power Reports:
We want to see how the environment performed between 6pm on 11/27 and 6pm on 11/28.
Instead of the DBA entering the environment, looking for several queries and manually validating the information about what happened during that period, there is a procedure in which he passes the email, the start date and the end date and several graphs like the ones below will be sent to his email.
With less than 5 minutes, it already has a lot of information available for analysis and in a visual form.
EXEC stpPowerReport_SQL_Performance @Ds_Email=‘[email protected]’,@Dt_Start=‘20221127 18:32’,@Dt_End=‘20221127 18:32’,@Ds_Query = NULL
The result of executing this procedure generates all the next graphs.
Graph with CPU information:

Graph with PLE memory counter information:

Chart with connection information in SQL Server:

Graph with the number of queries in the table with the Whoisactive Log:

Graph with pending I/O counter information:

Graph with available physical memory counter information:

Graph with the number of queries taking more than 3 seconds (and their average):

Graph with tempdb growth information (data):

Chart with information on the longest queries:

*After this chart comes part of the query code in the email (Query Id). I won't show it here to save space.
Chart with information about the longest jobs:

*After this chart comes the name of the Jobs in the email (Job Id). I won't show it here to save space.
Chart with information on the biggest SQL Server waits:

Here ends the graphics that we were able to send with just an F5 in the procedure: stpPowerReport_SQL_Performance
How long would it take the DBA to gather all this information?
Once again, Power Alerts increases productivity and saves DBA hours ($).
Other Power Reports that you can use on a daily basis:
Report with the growth of a database:
EXEC [dbo].[stpPowerReport_Database_Size] @Nm_Database=@Database_Name,@Ds_Email=@email

Report with the growth of a table:
EXEC [dbo].[stpPowerReport_Table_Size] @Nm_Database=DB_Name, @Nm_Table = Table_Name, @Ds_Email = Your_Email

Report to monitor the fragmentation of the bank's current indexes. ERP companies ask for this a lot when they open due to slowness.
EXEC [dbo].[stpPowerReport_Index_Fragmentation] @Ds_Email = Your_Email

Report to validate how the statistics are in the environment. In Power Tuning's opinion, up-to-date statistics are much more important than defragmented indexes. This job has to be a priority.
EXEC [dbo].[stpPowerReport_Update_Statistics] @Ds_Email = Your_Email

7) Customer feedback
Below are some screenshots of customer feedback that PowerTuning collected throughout our implementations:


8) Investment Power Alerts
Power Alerts is licensed per instance at the prices below:
- Licenses for Instances 1 to 4: R$240.00 per month per instance.
- Licenses for Instances 5 to 9: R$ 180.00 per month per instance.
- Licenses for Instances 10 to 19: R$ 120.00 per month per instance.
- Above 20 instances, negotiations directly via email: [email protected]
Monthly Value for 1 instance = R$ 240.00
Discounts:
Annual Plan with 20% discount
Annual plan value for 1 instance = R$ 2,304.00 (R$ 192.00 per month)
- 3 Year Plan with 40% discount
3-year flat price for 1 instance = R$ 5,184.00 (R$ 144.00 per month)
Customers who have monthly support with Power Tuning:
- Customers who have a monitoring contract with Power Tuning do not pay anything extra per month for Power Alerts.
- Customers who have a 24×7 DBA on-call contract with Power Tuning have a 50% discount.
There is also a single cost per instance (Total value R$ 1,400.00) for installation and configuration work for the reality of the environment and initial monitoring. This single amount is not discounted as these are DBA hours that will always have to be worked.
This is a product that will continue to evolve over time and the customer will be entitled to all improvements.
What is not included in this proposal:
- Technical improvement actions in the environment after the implementation of Alerts:
- Disk Full
- Log Full
- Base without Backup
- Slow Environment
- Other common day-to-day DBA problems
- Implementation of heavy Administration routines:
- Index maintenance, statistics updating and CheckDB routines will not be implemented in the environment.

Comentários (0)
Carregando comentários…