Hey guys,
Good morning!
In today's post I will demonstrate how to create a trace in SQL Server using SQL Profiler to audit access to objects, whether by a specific user, object or specific database. This is especially useful for identifying which users have access to a given object or also finding out which users do not have access to an object and still try to access it, be it a table, view, stored procedure, etc. In several companies, this is used to audit access to critical tables with sensitive information, such as employee data and salaries, etc.
A well-known utility for most SQL Server DBAs, but not so much for developers, SQL Server Profiler has many other uses besides carrying out audits, especially with the growth of systems that use ORMs, such as Hibernate and Entity Framework, to encapsulate database queries. These tools are responsible for generating SQL queries and queries for the developer, who only cares about coding in their programming language (Java, C#, etc.) and does not need to write a line of SQL code.
These queries are generally not very performant and the developer often does not know how the query was assembled by the ORM. When performance problems begin to occur in the system, SQL Server Profiler is a powerful tool, enabling the identification of which exact command the system is executing and allowing the DBA to carry out appropriate performance analysis, analyze indexes, etc.
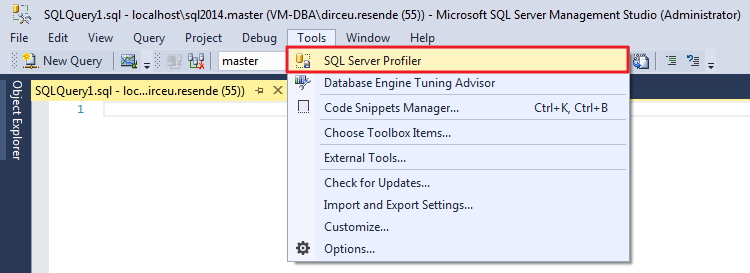
How to open SQL Server Profiler from Management Studio
Start SQL Server Management Studio and open SQL Server Profiler:
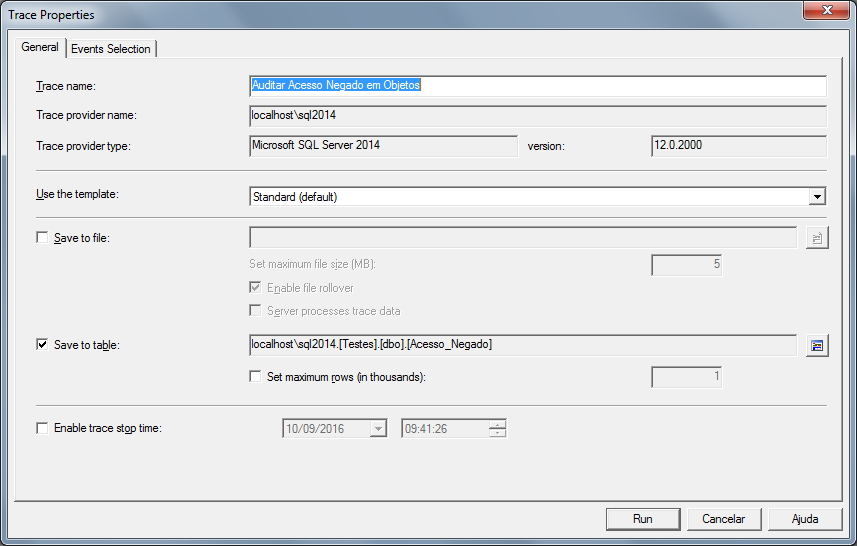
How to configure Trace events and filters in SQL Server Profiler
Once opened, configure the description of your trace, where the results will be saved (I always prefer in a table), and other settings that you find relevant:
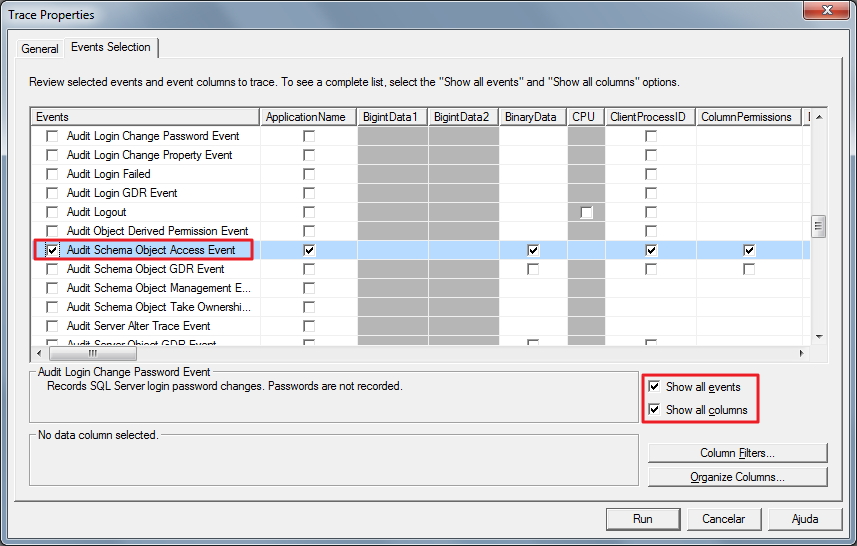
Now it is time to select the event that we will monitor, which is the “Audit Schema Object Access Event” and select the columns that we want to be recorded in the Trace table:
To adjust the trace capture filters, click on the “Column Filters” button and a window will open where it will be possible to perform the most diverse types of conditions for this session to be audited. I will list the most common ones:
- ApplicationName: Filter that is already activated by default and with the NOT LIKE clause “SQL Server Profiler –
” so that the Trace session itself is not audited, allows filters to be carried out using the software used to connect to the database, such as “Microsoft SQL Server Management Studio – Query” or “.Net SqlClient Data Provider”. - DatabaseName: Allows you to filter databases that may or may not be part of the trace
- DBUsername: Allows you to filter which SQL Server users can or cannot be part of the trace
- HostName: Filter that allows you to select which hostnames (machine names) will or will not be audited
- LoginName: Defines whether you want to apply a filter to the session login (can be AD or SQL Server login) so that it is part of Trace or not
- ObjectName: Allows you to filter objects (tables, views, stored procedures, etc.) that may or may not be part of the trace
- SPID: Filter that allows you to select which sessions will be audited or not by Trace
- Success: Essential parameter for this post, which defines whether the session was able to access the object (1) or whether it was unable to due to a permission error (0). To achieve the objective of this post, you must use the Equals to 0 condition
It is worth remembering that when editing filters, if you want to add more than one value to the filter clauses, simply press the “Enter” key when the cursor is positioned in the text box, so that more text boxes appear below:
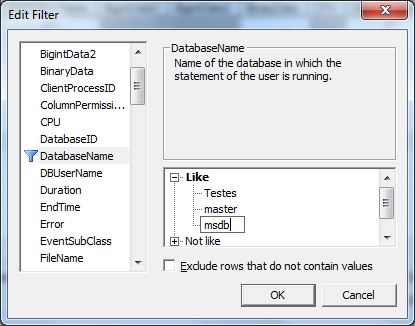
In this example, I applied the filter “Exclude rows that do not contain values” to the DatabaseName and DBUsername columns so that indirect access attempts, such as SQL Prompt and Intellisense perform, prevent not so interesting information from being written to the log and leaving it very “polluted”.
If you have started the Trace and are editing it, simply stop the Trace using the Stop button (or in the File > Stop Trace menu) and select the “File” > “Properties…” menu option.
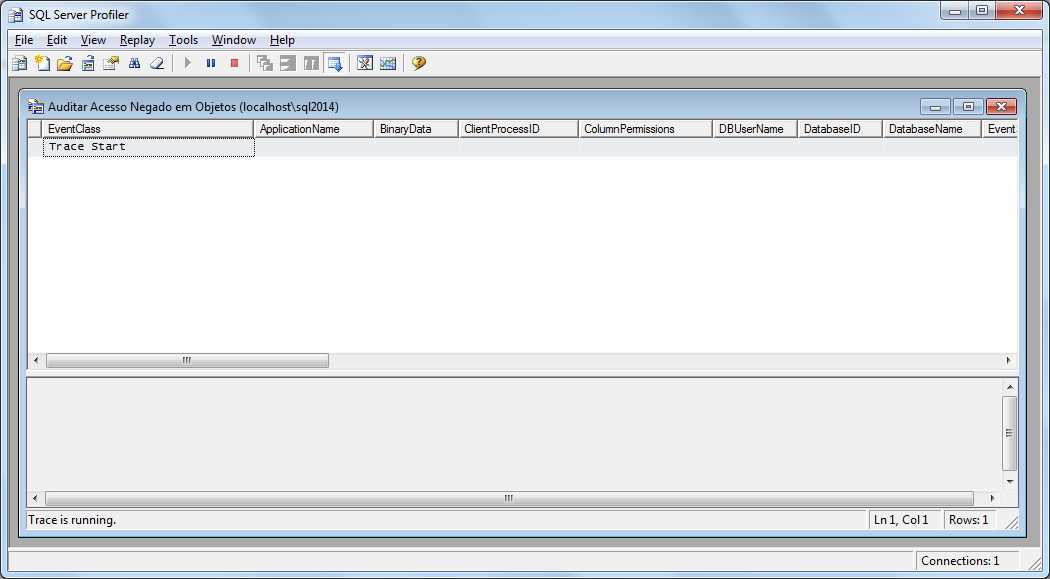
Now click on the “Run” button and the trace will start on the instance:
Viewing Trace results in SQL Server Profiler
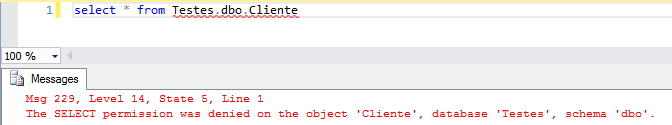
I will now use a user without permission and try to perform a query on a table that will generate a lack of permission error:
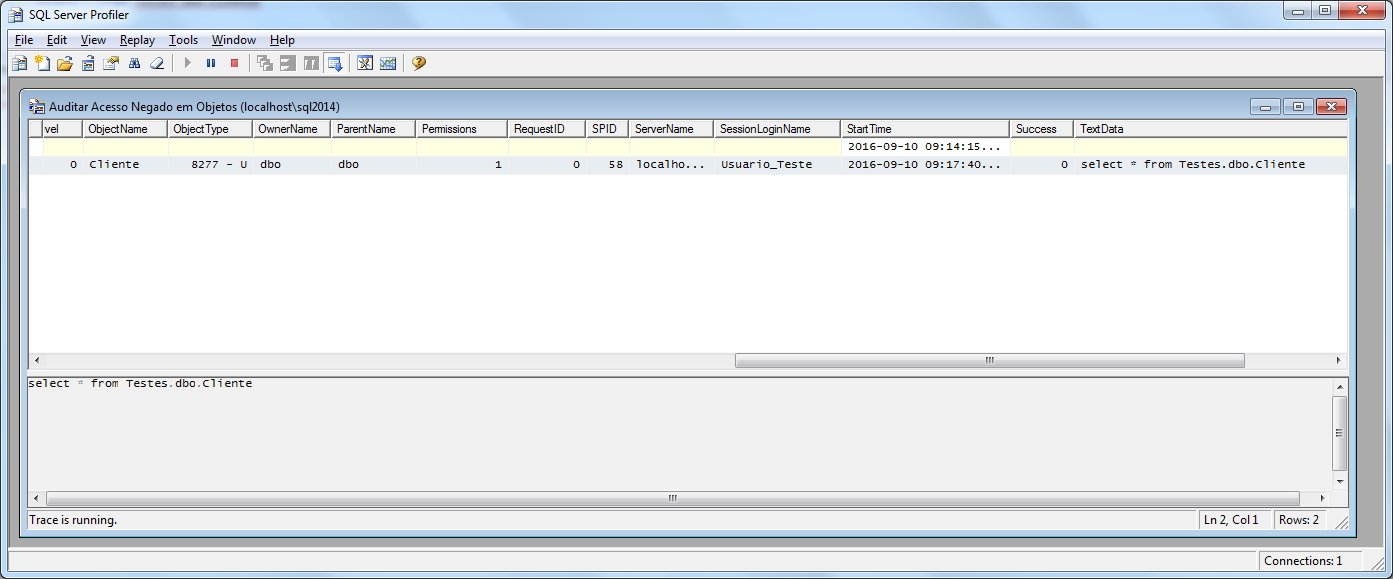
If we return to the SQL Server Profiler window, we will see that this access attempt was logged:
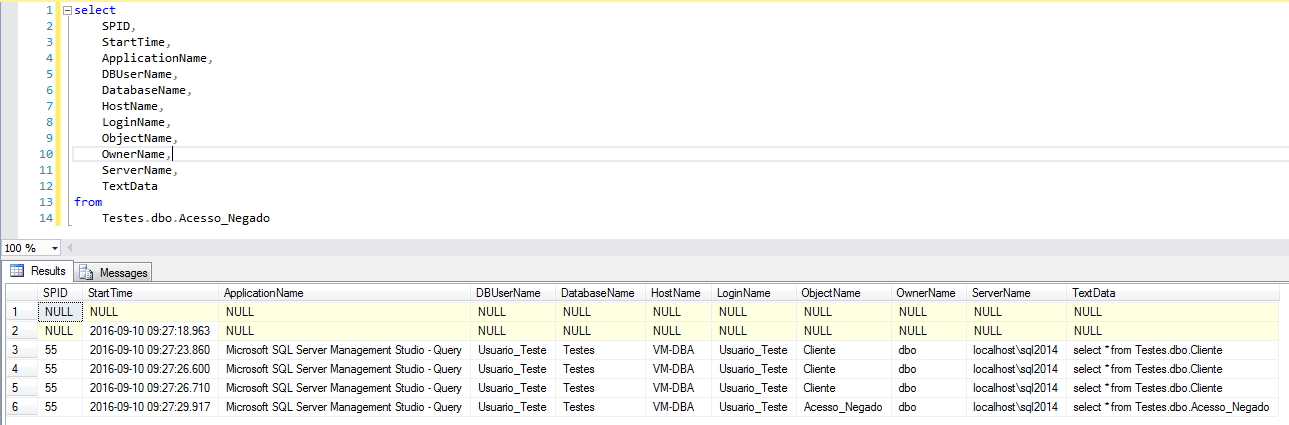
Or we can perform queries on the table in which we configured where Trace should save the results:
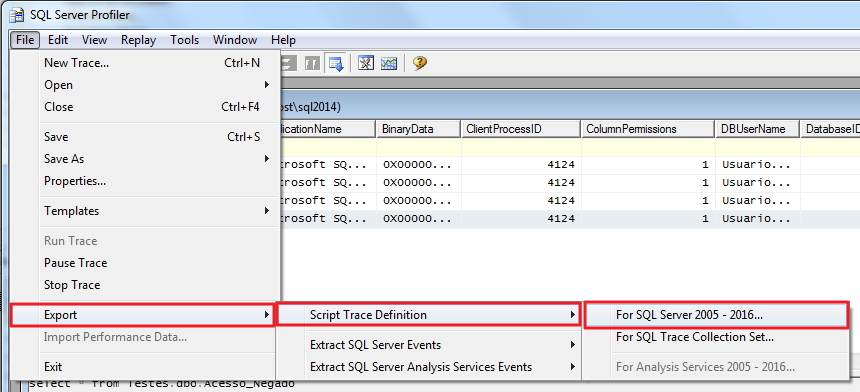
Exporting Trace definitions to an SQL file
SQL Server Profiler also gives us the option of exporting the definitions and filters made as a .sql file, so that you can activate this trace again in a more practical and faster way, and can even automate this in a Job, for example:
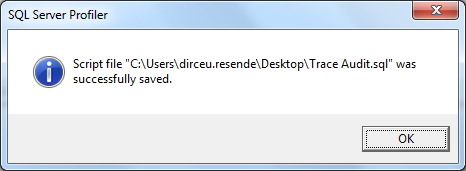
And this will be the result of exporting Trace as an SQL script:
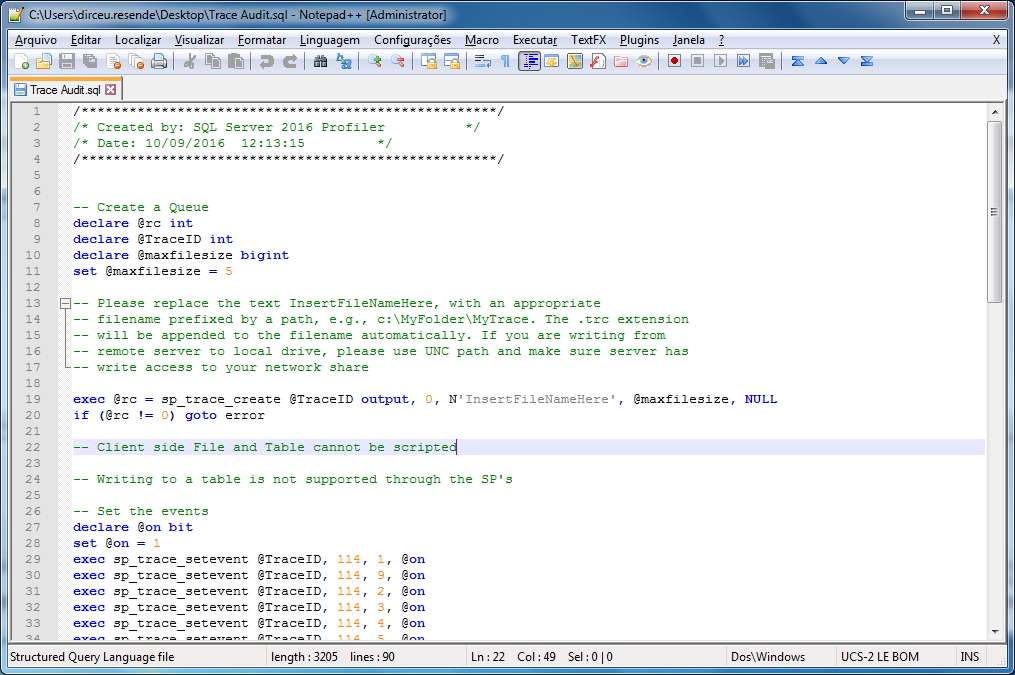
It is worth remembering that when you export the trace to .sql, exporting the data to the database table is NOT supported.
Querying SQL script-enabled Trace result
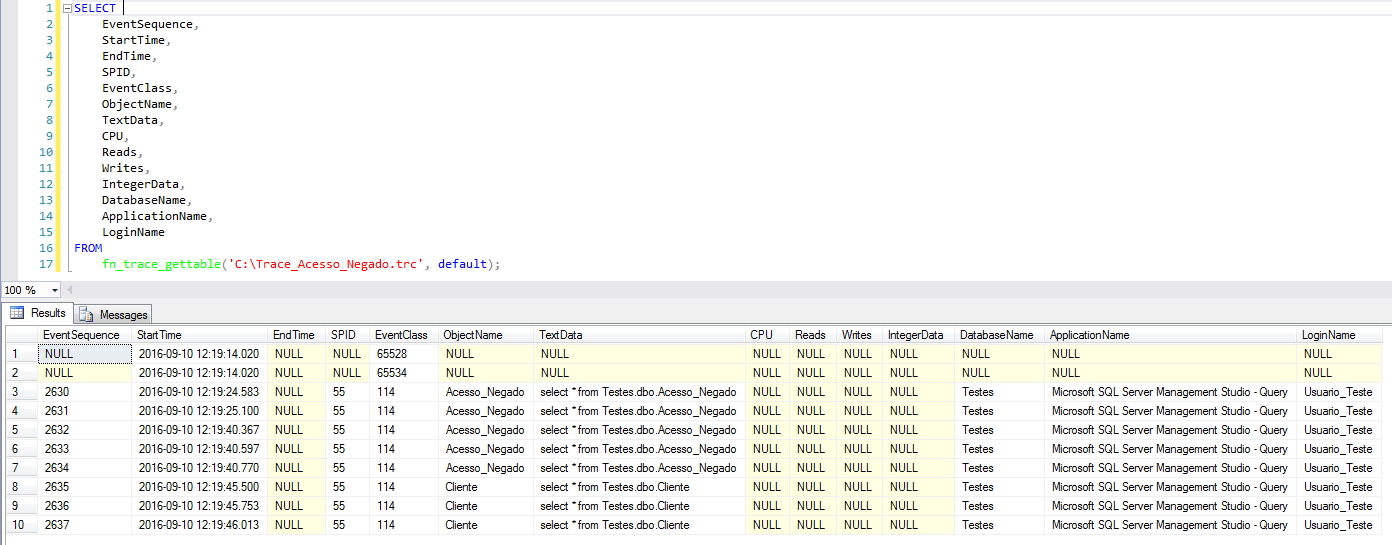
As explained above, using the script we can easily activate the trace, but it is not possible to export the data to a table, only to Trace files (.trc). Fortunately, this is not a problem, as we can easily query the trace file using the fn_trace_gettable function (Learn more by accessing the posts Using the standard SQL Server trace to audit events (fn_trace_gettable) and Monitoring DDL and DCL operations using SQL Server's fn_trace_gettable).
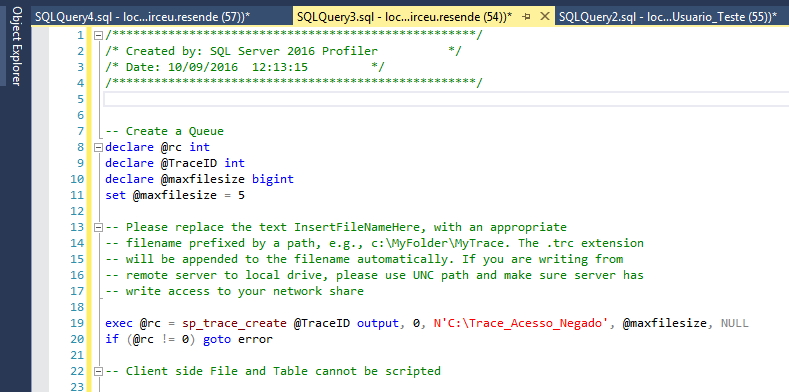
First, we open the SQL file generated in SQL Server Management Studio and change the Trace file name “InsertFileNameHere” to a path accessible by your server, as I did in the example below:
Then, let's try to consult the table and see the access denied message again. Now that the message has been logged into our trace file, we perform the query:
Identifying and stopping a trace event
If you choose to start trace events using the SQL script, it will be very important to be able to identify whether the trace is active and know how to stop it. To do this, simply run the query below
select * from sys.traces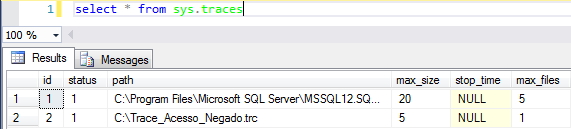
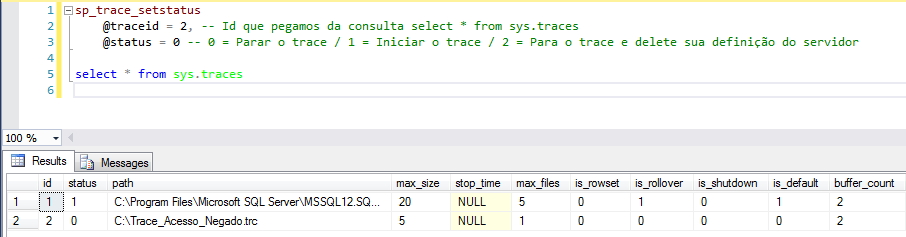
Once we have retrieved the ID of our trace, let's now stop it and check if it really is no longer active:
And that's it, folks!
The idea was to create a specific post about object access auditing, which ended up becoming a mini-tutorial on SQL Server Profiler.
I hope you enjoyed the post and see you next time.

Comentários (0)
Carregando comentários…