Hey guys,
All good ?
In this post I would like to start talking about a subject that I really like, which is Performance Tuning, a subject on which I have already spoken at the 2nd Meeting of the SQL Server ES Chapter – 06/10/2017.
This topic is always among the most sought after by database professionals, developers and companies looking for experienced DBA consultancy. Unlike many areas of the database, Performance Tuning always requires an analysis of the problem and several tests before taking any action. Although there are good practices for this, there is no magic formula or “cake recipe” that will always solve performance problems, regardless of the scenario and environment.
I hope you like this series 🙂
Why is Performance Tuning so important?
- “In today’s world, most people don’t have the patience to wait for a website to load for a long time and end up visiting another one right away.” (escoladomarketingdigital.com.br)
- “On average, users will leave any website if it doesn’t load on their phone within three seconds” (Google)
- One of the biggest reasons for the failure of Windows Vista was the fact that it was an extremely heavy and slow system (tecnoblog.net)
- "HP's TouchPad tablet was one of the most anticipated launches of 2011 - and soon became the biggest failure of the year. The device, created to compete with Apple's iPad, lasted just seven weeks on the market before HP took the decision to put an end to it, citing poor sales as the reason. The reason? Consumers immediately recognized that the cell phone was too slow" (estadao.com.br)
- “55% of students in Canada admit to being stressed by slow computers, resulting in Hourglass Syndrome.” (nytimes.com)
- “66% of Americans are stressed by slow computers and 23% describe themselves as very stressed because of it.” (reuters.com)
In today's scenario, users no longer have the patience to wait for a screen to load or for a button to be clicked. Users want quick responses from the systems and to achieve this, the database must provide conditions for the systems to be able to query the data in the database without causing delays in the system.
To do this, the DBA needs to have the knowledge to identify possible slowdowns, which can be caused by several factors:
- Absence of indexes on the table or inefficient indexes for a given query
- Fragmentation of indexes or tables
- Locks
- Wait events (Ex: PAGEIOLATCH_EX, OLEDB, etc.)
- Poorly written query
- Overloaded CPU
- High disk read time
- Very large volume of information
- tempdb containment
- Network issues
What does Performance Tuning work like?
To carry out a tuning performance analysis, I will list the activities that are generally necessary to achieve your objective:
Understand the problem
This activity of the performance tuning process consists of identifying, in a macro way, the origin of the slowness in the environment. If you already know which routine you are going to try to optimize, this process is already complete.
In this activity, you must consult your instance's routines and data collections to analyze, for example:
- Routines with high time duration
- Routines that have a high CPU time
- Routines with high I/O volume (reads/writes)
- Server log analysis
- Analysis of instance wait events
- Block and deadlock history analysis
- Analysis of the history of routines running at the time of slowness
- Block and deadlock history analysis
- Index and table fragmentation reports
- Table reports without statistics update
- missing index reports
In order to understand and identify the problem, you must have all (or a good part) of the controls indicated above. They will provide you with data and information about what happens in your instance when a performance problem occurs.
Prepare the diagnosis
Now that you've identified what's causing the slowness, now it's time to find out why it's happening. In this step, we will take a micro look at the specific routine that is performing poorly, in order to break it down and discover queries that can be optimized.
In this activity, we have several ways to help with the analysis, such as:
- Analysis of the execution plan, to identify how the query is being done internally (and identify possible anomalies, such as implicit conversion)
- Analysis of the indexes used, to ensure that they are covering the heaviest queries (covering index)
- Use of SET STATISTICS IO and TIME, to measure the number of reads/writes that are performed for each object consulted, as well as the response time of each operation
- In many cases, the database structure is optimized, but the query is poorly written. Therefore, the query may undergo changes to optimize the use of existing indexes
- Analyze the index histogram to validate whether it is really being effective and making sense
Apply optimization tips and techniques
Once you have identified the queries that are showing low performance, it is time to apply performance tuning techniques, be it changing the query (query tuning), creating/changing indexes, updating statistics, etc.
At this stage, you will probably need to test more than one improvement to achieve the best result, depending on your environment. In many cases, you will need one more change for the query to be optimized.
Tests, Tests, Tests and then, more Tests!
This step, along with the Apply optimization tips and techniques step, are probably the ones that will require the most of your time. All performance tuning work requires that changes be tested and validated before being applied to the environment.
As I mentioned previously, there is no “cake recipe” that will always be more performant in all situations (although there are good practices that GENERALLY perform better). I've seen several cases where a change gave a huge performance gain in one environment, and in the other it ended up having no effect. Remember: There are N factors that can influence your bank's performance and they must all be considered.
From my experience, I recommend you: NEVER apply a performance improvement without testing THOROUGHLY before applying. This is especially recommended if you have made changes to the query to achieve better performance. In my daily life, I make changes to queries in both the structural and business rule aspects, so testing ends up being even more important.
Apply optimization
In the final stage of the Performance Tuning process, which is generally the calmest, you will apply the suggested changes to your environment after an intense battery of tests already carried out.
If you have more than one environment in your company (Ex: DEV, HOM, PRD), it is very interesting to upload the changes per environment, in order to observe the system's behavior after the changes.
An extremely important part of this stage is collecting the results obtained after applying the changes. This part of the Performance Tuning project is vital to gain trust in the DBA's work and be able to show the advantages obtained on a daily basis by investing time (and consequently, money) in this work within the company.
Performance Tuning – Indexes
Database indexes are one of the most important structures (perhaps the most) when it comes to query performance. Indexes are disk structures associated with a table or view, which speed up row retrieval by ordering data in the form of binary trees.
Using an analogy, it would be like the index or summary of a book, allowing you to quickly search for what you are searching for. Although indexes are extremely useful and effective, they must be created with great rigor and discretion: Indexes take up disk space, that is, if you create many indexes, they can take up more space than the table itself.
Furthermore, indexes speed up queries, but slow down writing operations (INSERT, UPDATE, DELETE), because these operations need to update the table and data from all related indexes. If you have a table that requires a lot of writing and few readings (Ex: Log/History table), this table may not be a good candidate for creating indexes. CAREFUL!
Some great candidates to be part of an index are frequently accessed computed (calculated) columns, columns that are part of a Foreign Key (FK), identity column of the table.
Another great candidate for creating an index can be identified after a deeper analysis where you have identified a very heavy query that is performed frequently in your environment. In this case, you will create a specific index for this query, which will have all the columns used by this query, in a technique known as Covering Index.
If you want to delve deeper into indexes in SQL Server, I recommend reading the post Understanding how indexes work in SQL Server.
Performance Tuning – The Execution Plan
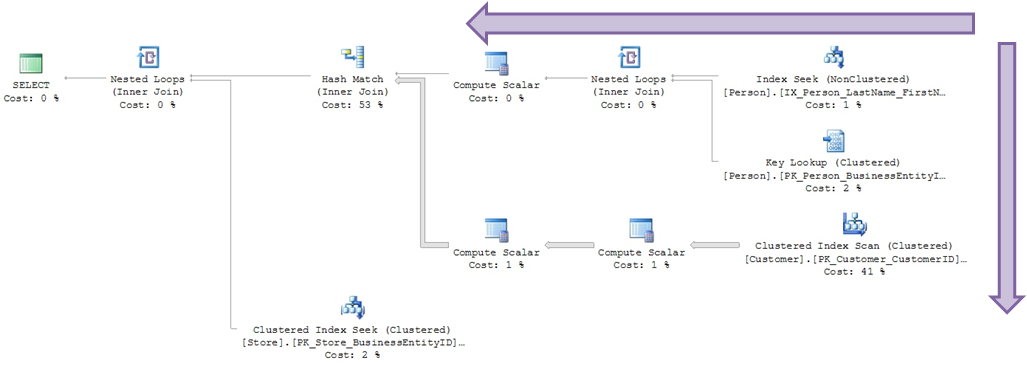
The Execution Plan is a graphical tool to help the DBA/Developer understand how queries are being performed in the database and interpreted by the query optimizer. This tool is extremely important for anyone thinking about carrying out query optimization work on the database, as it is only by understanding how the query is being done internally that it is possible to identify points for improvement.

Example of an execution plan being analyzed
What can we extract from a plan?
- Are you using index?
- What index was used?
- Parallel work?
- How large is the data?
- What is the highest cost operation?
- Which operator was used?
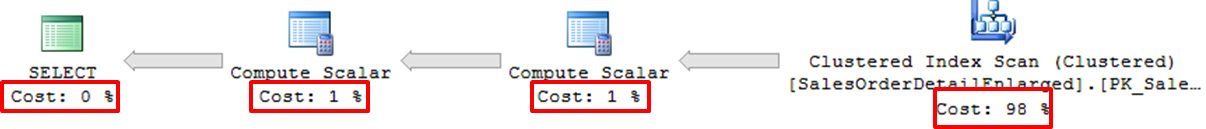
How do we read a plan?
Arrows indicate volume of records processed:

Percentage of the cost of each operation
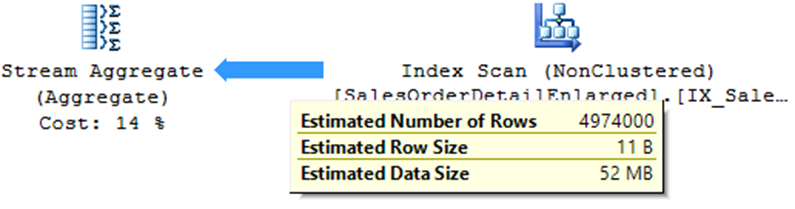
Detailed information via ToolTips
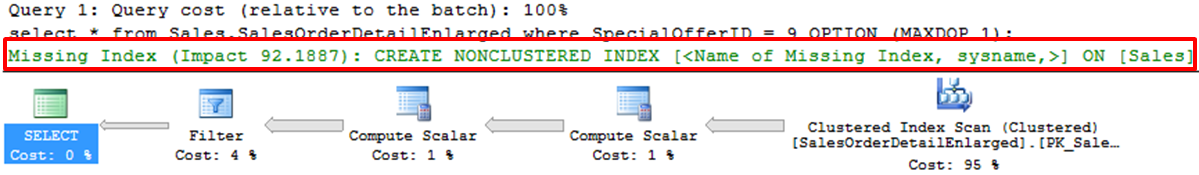
Index suggestion
What is the difference between estimated and current plan?
Estimated plan:
- Useful for development where you cannot run the query
- Very useful in scenarios where the original query takes a long time to process
- Does not work with temporary objects
- Does not identify some warnings (Ex: Residual I/O)
- Based on statistics (if they are out of date, they can distort reality)
Current plan:
- The original query is executed in the database
- At the end of the operations, the execution plan that was actually used by the query optimizer is shown
How do I view my query execution plan?
To be able to view the execution plan of the query you are going to execute, simply select one of the 2 options marked in the print below:
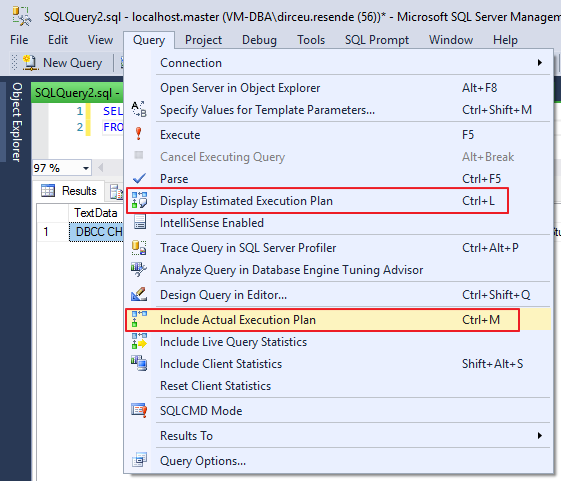
Option in the interface to display the execution plan
However, they have different behaviors: When selecting the “Include Actual Execution Plan” option, queries performed from that moment on will return the plan generated at the end of the execution.
The “Display Estimated Execution Plan” option should be used when selecting the queries in which you want to view the estimated plan.
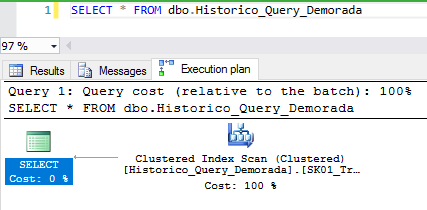
Regardless of the way chosen, once the option is selected, simply execute your query (Current plan) or view the plan of the selected queries (Estimated plan) to view the execution plan graphically in your Management Studio (SSMS):
Another way to view the estimated execution plan is through SET commands:
SET SHOWPLAN_ALL OFF
GO
SET SHOWPLAN_XML ON
GO

SELECT * FROM dbo.Historico_Query_Demorada
GO

SET SHOWPLAN_XML OFF
GO
SET SHOWPLAN_ALL ON
GO

SELECT * FROM dbo.Historico_Query_Demorada
Result:

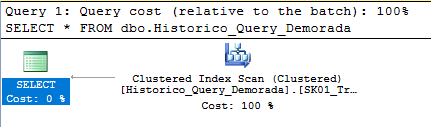
To graphically view the execution plan, just click on the generated XML:
How to view the execution plan of a running query?
To view the execution plan of running queries, simply run the query below:
SELECT
    A.session_id,
    B.command,
    A.login_name,
    C.query_plan
FROM
    sys.dm_exec_sessions AS A WITH (NOLOCK)
    LEFT JOIN sys.dm_exec_requests AS B WITH (NOLOCK) ON A.session_id = B.session_id
    OUTER APPLY sys.dm_exec_query_plan(B.[plan_handle]) AS C
WHERE
    A.session_id > 50
    AND A.session_id <> @@SPID
    AND (A.[status] != 'sleeping' OR (A.[status] = 'sleeping' AND A.open_transaction_count > 0))
If you want to know all the information about running queries, including CPU usage, tempdb, reads, writes, the query execution plan itself and much more, take a look at the simplified version of sp_whoisactive that I made available in the post SQL Server – Query to return running queries (sp_WhoIsActive without consuming TempDB).
How to view cached execution plans?
Generally, when you execute a query, SQL Server will generate an execution plan for it and leave this plan stored in the database cache, so that in case the same query is executed again, the query optimizer does not need to analyze the query and generate a new plan. Therefore, it is possible to view the plans that are saved in cache in SQL Server.
It is worth remembering that every time the instance is restarted, the cached plans are discarded. SQL Server also only keeps the most used plans, as it cannot store the plans for each query already performed on the instance.
To view cached plans, simply use the query below:
SELECT
    cp.objtype AS ObjectType,
    OBJECT_NAME(st.objectid, st.dbid) AS ObjectName,
    cp.usecounts AS ExecutionCount,
    st.text AS QueryText,
    qp.query_plan AS QueryPlan
FROM
    sys.dm_exec_cached_plans AS cp
    CROSS APPLY sys.dm_exec_query_plan(cp.plan_handle) AS qp
    CROSS APPLY sys.dm_exec_sql_text(cp.plan_handle) AS st
ORDER BY
    ExecutionCount DESC
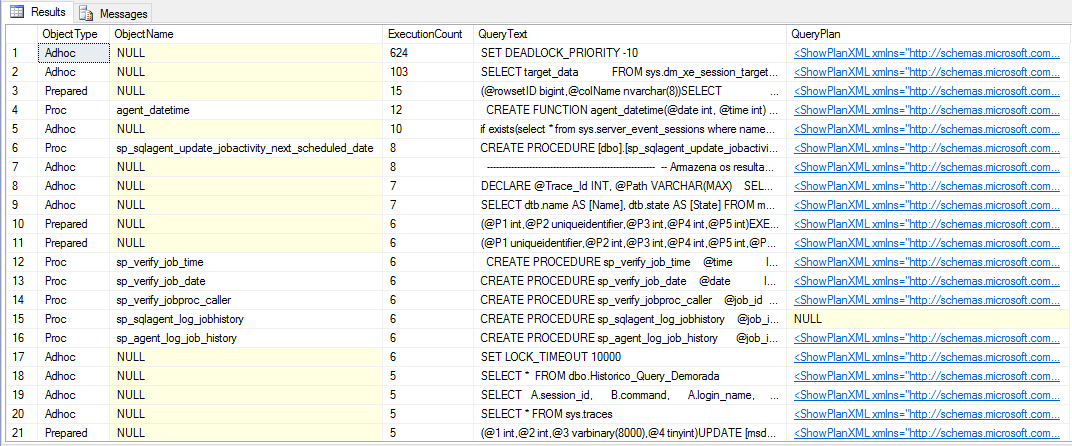
Result:
How to delete cached execution plans?
As I mentioned above, keeping execution plans in cache is a good practice to avoid the query optimizer having to analyze queries and generate new execution plans unnecessarily. However, in several situations it is important that you can delete a specific plan from the cache or even all plans.
To clear your instance's entire cache, simply run the command below:
DBCC FREEPROCCACHE
GO
To clear the entire cache for a given database, run this command:
DECLARE @DbID INT = (SELECT database_id FROM sys.databases WHERE [name] = 'dirceuresende')

DBCC FLUSHPROCINDB (@DbID)
GO
To delete the cache of a stored procedure or function, simply execute an alter procedure/alter function command and the plan is recreated.
An interesting option is the hint WITH RECOMPILE, which when used when changing an object, causes a new execution plan to be created with each call to that object.
ALTER PROCEDURE [dbo].[stpTeste]
WITH RECOMPILE -- A cada execução, será gerado um novo plano
AS
BEGIN

    SELECT 1

END
Another way to force the recompilation of an object and generate a new execution plan is by using the internal Stored Procedure sp_recompile:
sp_recompile @objname = 'dbo.stpBusca_Rastreamento_Correios'

Who are the main operators of the Execution Plan?
In this session, I will list the most common operators that you will see most frequently during your analyses.
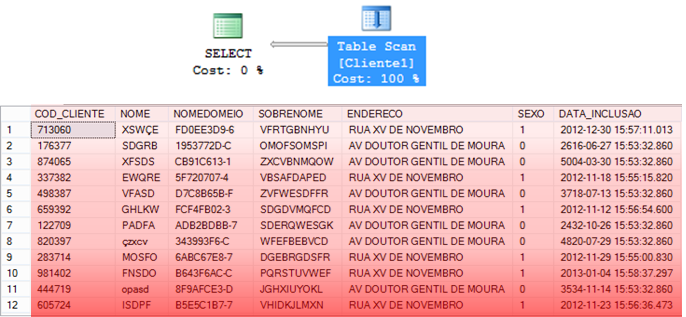
Table Scan
– Operator that consists of reading ALL the data in the table to find the information that should be returned.
– Happens on a table without a cluster index
– In general, high-cost operation
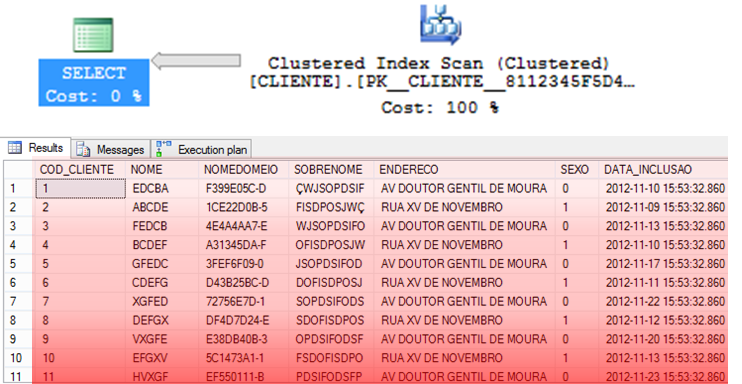
Clustered Index Scan
– Operator that consists of reading ALL data from the CLUSTERED index to find the information that should be returned.
– In general, it is usually a little faster than Table Scan, as the data is already ordered in the index.
– Index Scan can be a reflection of an expensive Lookup
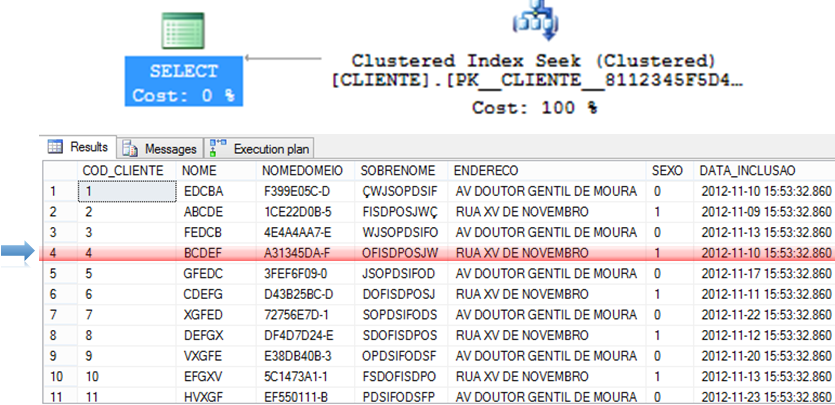
Clustered Index Seek and NonClustered Index Seek
– Algorithm that tends to be extremely efficient for returning specific records.
– As the data is already ordered in the index, you can use more efficient algorithms such as QuickSort and ShellSort.
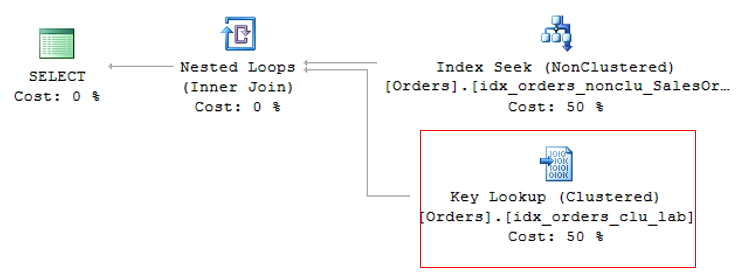
Key Lookup and RID Lookup
When a query is performed on a table, the SQL Server query optimizer will determine the best data access method according to the statistics collected and choose the one that has the lowest cost.
As the clustered index is the table itself, generating a large volume of data, the lowest cost non-clustered index is generally used for the query. This can create a problem, as the query is often selecting columns where not all are indexed, causing a non-clustered index to be used to search for the indexed information (Index Seek NonClustered) and the clustered index to return the remaining information, where the non-clustered index has a pointer to the exact position of the information in the clustered index (or the ROWID, if the table does not have a clustered index).
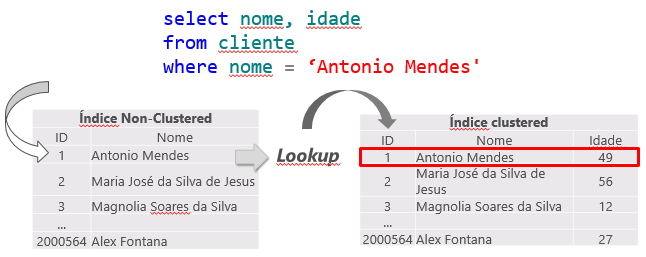
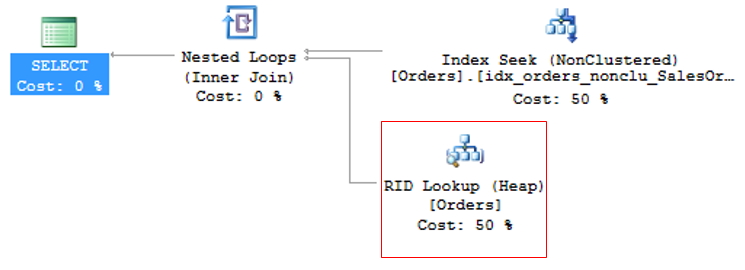
This operation is called Key Lookup, in the case of tables with a clustered index or RID Lookup (RID = Row ID) for tables that do not have a clustered index (called HEAP tables) and because it generates 2 read operations for a single query, it should be avoided whenever possible.
Key Lookup
RID Lookup
To avoid KeyLookup, simply use the Covering index technique, which consists of adding the main columns that are used in table queries to the NonClustered (INCLUDE) index. This means that the query optimizer can obtain all the information by reading only the chosen index, without having to also read the clustered index.
However, great attention must be paid to modeling the indices. It is not recommended to add all table columns to the non-clustered index, as it will become so large that it will no longer be effective and the query optimizer may even decide not to use it and prefer the Index Scan operator, which reads the entire index sequentially, damaging query performance.
To avoid RID Lookup, simply create the clustered index on the table and pay attention to Key Lookup events that may arise.
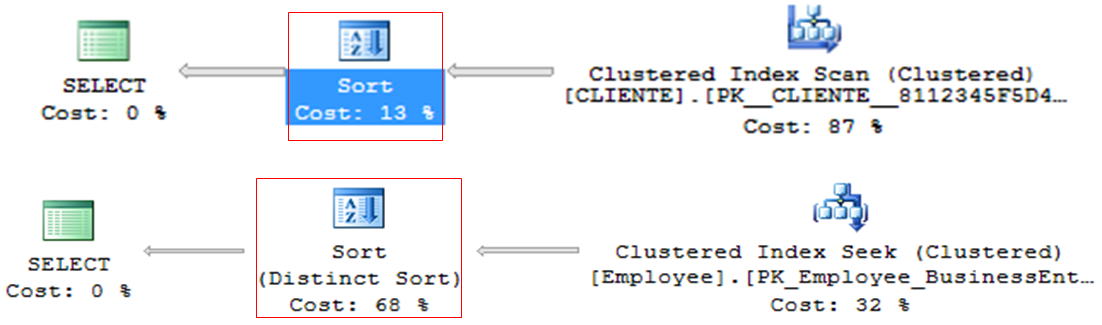
Sort
– Operator that tends to be very heavy in queries, especially with large volumes of data
– Line by line processing
– ORDER BY or DISTINCT
– Generally, it can be discarded and ordered in the application (DBA x DEV fight)
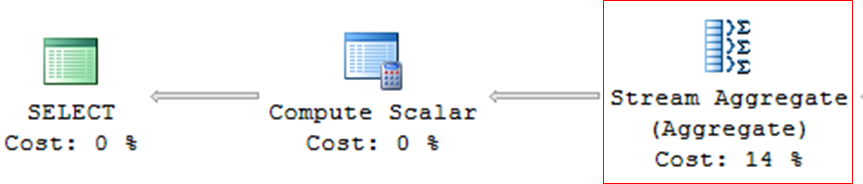
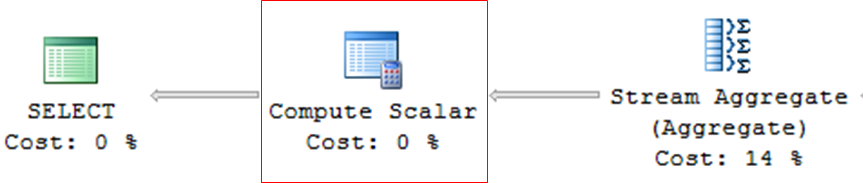
Stream Aggregate
– Queries with grouping (GROUP BY, DISTINCT, etc.)
– Operator who tends to be very heavy in consultations
Compute Scalar
– Operator used in queries with expressions, mathematical calculations or conversions (CAST, CONVERT)
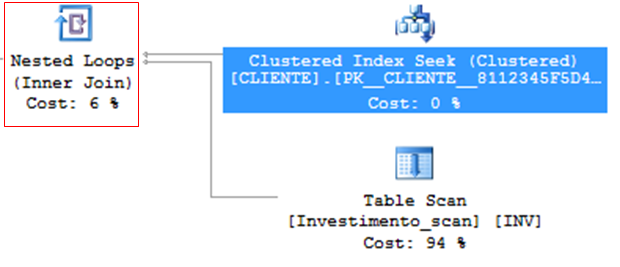
Nested Loops
– Very efficient algorithm
– Ideal for scenarios with few records
– For each row in the outer table, scan all of them in the inner table.
– Low CPU and memory consumption
– Table variable (@Table) will ALWAYS use Nested Loops, regardless of the number of records, because as it does not have statistics, the estimated number of rows is always 1 (unless you force it with a hint).
How it works internally:
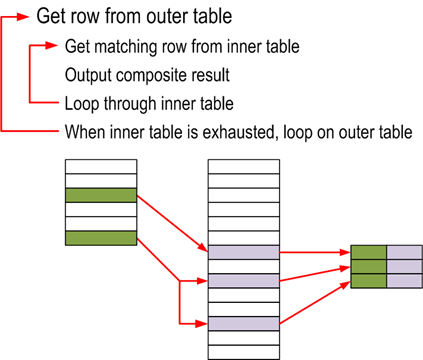
Algorithm used:
for each row R1 in the outer table
    for each row R2 in the inner table
        if R1 joins with R2
            return (R1, R2)
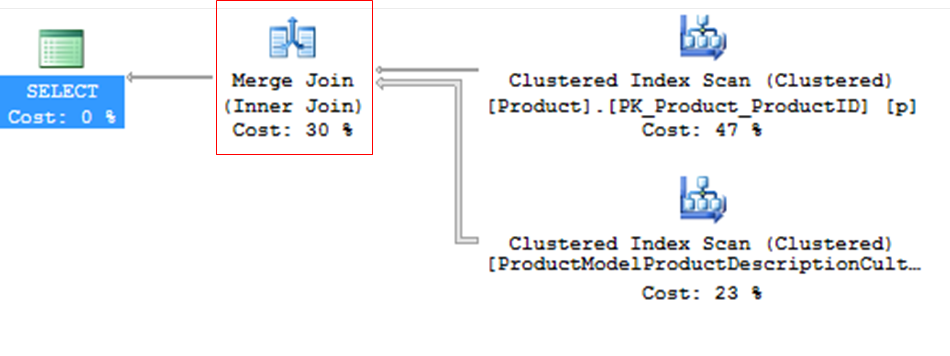
Merge Join
– Efficient, but needs ordered data
– Ideal for scenarios with many records
– If the data is not sorted, Merge Join may request sorting through a Sort Merge Join
– If both tables do not have a unique index, Merge Join Many to Many occurs – tables without PK, use tempdb, less efficient
– Merge Join and its impact on TEMPDB – Much higher consumption than Nested Loop, as matches are made in memory and the data volume is usually larger as well.
– In general, it consumes little CPU and memory. Often found in queries with covering indexes.
How it works internally:
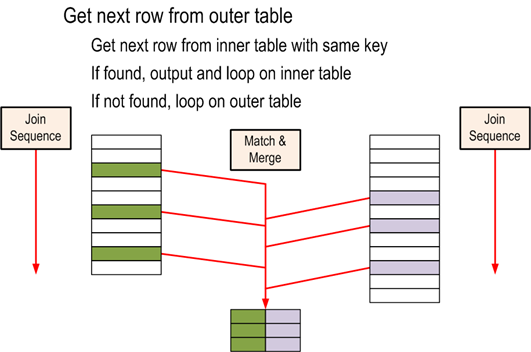
Algorithm used:
get first row R1 from input 1
get first row R2 from input 2
while not at the end of either input
    begin
        if R1 joins with R2
            begin
                return (R1, R2)
                get next row R2 from input 2
            end
        else if R1 < R2
            get next row R1 from input 1
        else
            get next row R2 from input 2
    end
Some tips for troubleshooting
– Lookup: Solve with Covering index or INCLUDE
– Index Scan can be a reflection of an expensive Lookup! Pay attention!
– Be careful with Conversions, especially conversions in the WHERE clause. They can be deadly for your appointment!
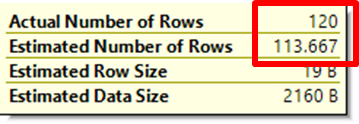
– Pay attention to outdated statistics: Estimated number <> current number
– Parameter sniffing: Occurs when the same SP has different types of behavior according to the parameters informed, meaning that the plan used is not appropriate. Try creating different procedures for each parameter or adding a WITH RECOMPILE or Hint OPTION (RECOMPILE) clause.
Well, that's it, folks!
This post is just an introduction to the “art” of Performance Tuning and was due about 3 months ago, when I gave my talk at the 2nd SQL Server ES meeting and I didn't write this post to complement the presentation for those who didn't go.
I hope to be back soon with new posts on this subject, which I find so interesting.
A hug and see you next time!

Comentários (0)
Carregando comentários…