Hey guys!
In this post, I would like to demonstrate some ways to identify slow or heavy queries, which end up consuming a lot of machine resources and end up taking a long time to return results, whether due to excessive CPU, memory or disk usage.
The purpose of this article is to help you with identification of queries that have potential performance problems. Once you have identified what these queries are, you must evaluate whether it is necessary to add more hardware to the machine or start performance and query tuning activities (which is not the focus of this post).
Wait event analysis
View contentA good starting point for our analysis is by consulting the DMV sys.dm_os_wait_stats, with the query below:
SELECT *
FROM sys.dm_os_wait_stats
ORDER BY wait_time_ms DESC
Result:
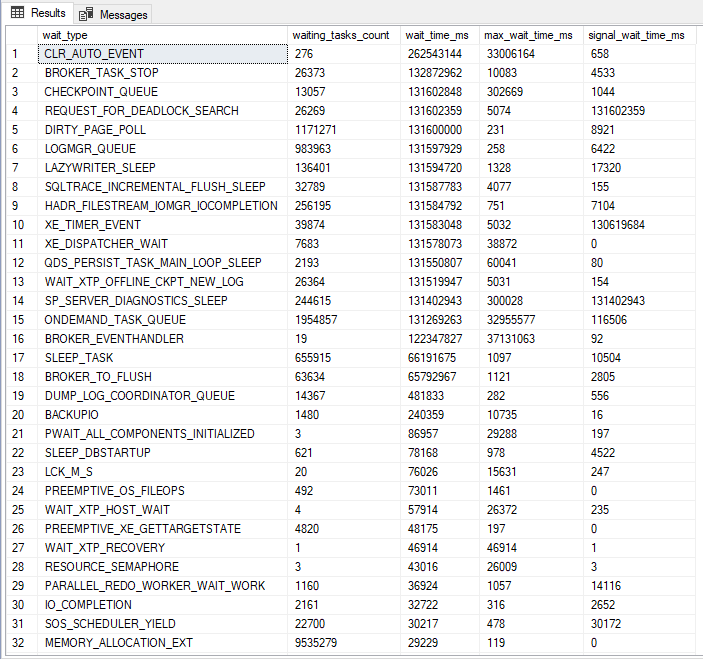
This query will show which waiting events took the most time, that is, it will evaluate, among everything that was executed on the instance, what caused these queries to wait for resources the most, be it disk, CPU, memory, network, etc. This is very useful for identifying where our biggest processing bottleneck is.
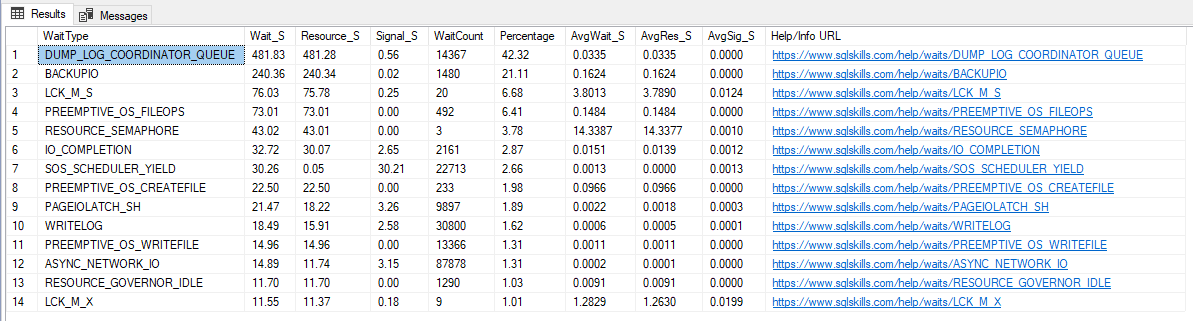
The big one Paul Randal made a version of this query available, which brings some statistics about these wait events, such as % of wait time and a link to the explanation of what this wait event is, and also filters events that are generally just warnings and not problems, making it easier to identify what is really bothering our instance.
Following script:
;WITH [Waits]
AS ( SELECT
         [wait_type],
         [wait_time_ms] / 1000.0 AS [WaitS],
         ( [wait_time_ms] - [signal_wait_time_ms] ) / 1000.0 AS [ResourceS],
         [signal_wait_time_ms] / 1000.0 AS [SignalS],
         [waiting_tasks_count] AS [WaitCount],
         100.0 * [wait_time_ms] / SUM([wait_time_ms]) OVER () AS [Percentage],
         ROW_NUMBER() OVER ( ORDER BY
                                 [wait_time_ms] DESC
                           ) AS [RowNum]
     FROM
         sys.dm_os_wait_stats
     WHERE
         [wait_type] NOT IN (
                                -- These wait types are almost 100% never a problem and so they are
                                -- filtered out to avoid them skewing the results. Click on the URL
                                -- for more information.
                                N'BROKER_EVENTHANDLER', -- https://www.sqlskills.com/help/waits/BROKER_EVENTHANDLER
                                N'BROKER_RECEIVE_WAITFOR', -- https://www.sqlskills.com/help/waits/BROKER_RECEIVE_WAITFOR
                                N'BROKER_TASK_STOP', -- https://www.sqlskills.com/help/waits/BROKER_TASK_STOP
                                N'BROKER_TO_FLUSH', -- https://www.sqlskills.com/help/waits/BROKER_TO_FLUSH
                                N'BROKER_TRANSMITTER', -- https://www.sqlskills.com/help/waits/BROKER_TRANSMITTER
                                N'CHECKPOINT_QUEUE', -- https://www.sqlskills.com/help/waits/CHECKPOINT_QUEUE
                                N'CHKPT', -- https://www.sqlskills.com/help/waits/CHKPT
                                N'CLR_AUTO_EVENT', -- https://www.sqlskills.com/help/waits/CLR_AUTO_EVENT
                                N'CLR_MANUAL_EVENT', -- https://www.sqlskills.com/help/waits/CLR_MANUAL_EVENT
                                N'CLR_SEMAPHORE', -- https://www.sqlskills.com/help/waits/CLR_SEMAPHORE
                                N'CXCONSUMER', -- https://www.sqlskills.com/help/waits/CXCONSUMER

                                -- Maybe comment these four out if you have mirroring issues
                                N'DBMIRROR_DBM_EVENT', -- https://www.sqlskills.com/help/waits/DBMIRROR_DBM_EVENT
                                N'DBMIRROR_EVENTS_QUEUE', -- https://www.sqlskills.com/help/waits/DBMIRROR_EVENTS_QUEUE
                                N'DBMIRROR_WORKER_QUEUE', -- https://www.sqlskills.com/help/waits/DBMIRROR_WORKER_QUEUE
                                N'DBMIRRORING_CMD', -- https://www.sqlskills.com/help/waits/DBMIRRORING_CMD

                                N'DIRTY_PAGE_POLL', -- https://www.sqlskills.com/help/waits/DIRTY_PAGE_POLL
                                N'DISPATCHER_QUEUE_SEMAPHORE', -- https://www.sqlskills.com/help/waits/DISPATCHER_QUEUE_SEMAPHORE
                                N'EXECSYNC', -- https://www.sqlskills.com/help/waits/EXECSYNC
                                N'FSAGENT', -- https://www.sqlskills.com/help/waits/FSAGENT
                                N'FT_IFTS_SCHEDULER_IDLE_WAIT', -- https://www.sqlskills.com/help/waits/FT_IFTS_SCHEDULER_IDLE_WAIT
                                N'FT_IFTSHC_MUTEX', -- https://www.sqlskills.com/help/waits/FT_IFTSHC_MUTEX

                                -- Maybe comment these six out if you have AG issues
                                N'HADR_CLUSAPI_CALL', -- https://www.sqlskills.com/help/waits/HADR_CLUSAPI_CALL
                                N'HADR_FILESTREAM_IOMGR_IOCOMPLETION', -- https://www.sqlskills.com/help/waits/HADR_FILESTREAM_IOMGR_IOCOMPLETION
                                N'HADR_LOGCAPTURE_WAIT', -- https://www.sqlskills.com/help/waits/HADR_LOGCAPTURE_WAIT
                                N'HADR_NOTIFICATION_DEQUEUE', -- https://www.sqlskills.com/help/waits/HADR_NOTIFICATION_DEQUEUE
                                N'HADR_TIMER_TASK', -- https://www.sqlskills.com/help/waits/HADR_TIMER_TASK
                                N'HADR_WORK_QUEUE', -- https://www.sqlskills.com/help/waits/HADR_WORK_QUEUE

                                N'KSOURCE_WAKEUP', -- https://www.sqlskills.com/help/waits/KSOURCE_WAKEUP
                                N'LAZYWRITER_SLEEP', -- https://www.sqlskills.com/help/waits/LAZYWRITER_SLEEP
                                N'LOGMGR_QUEUE', -- https://www.sqlskills.com/help/waits/LOGMGR_QUEUE
                                N'MEMORY_ALLOCATION_EXT', -- https://www.sqlskills.com/help/waits/MEMORY_ALLOCATION_EXT
                                N'ONDEMAND_TASK_QUEUE', -- https://www.sqlskills.com/help/waits/ONDEMAND_TASK_QUEUE
                                N'PARALLEL_REDO_DRAIN_WORKER', -- https://www.sqlskills.com/help/waits/PARALLEL_REDO_DRAIN_WORKER
                                N'PARALLEL_REDO_LOG_CACHE', -- https://www.sqlskills.com/help/waits/PARALLEL_REDO_LOG_CACHE
                                N'PARALLEL_REDO_TRAN_LIST', -- https://www.sqlskills.com/help/waits/PARALLEL_REDO_TRAN_LIST
                                N'PARALLEL_REDO_WORKER_SYNC', -- https://www.sqlskills.com/help/waits/PARALLEL_REDO_WORKER_SYNC
                                N'PARALLEL_REDO_WORKER_WAIT_WORK', -- https://www.sqlskills.com/help/waits/PARALLEL_REDO_WORKER_WAIT_WORK
                                N'PREEMPTIVE_XE_GETTARGETSTATE', -- https://www.sqlskills.com/help/waits/PREEMPTIVE_XE_GETTARGETSTATE
                                N'PWAIT_ALL_COMPONENTS_INITIALIZED', -- https://www.sqlskills.com/help/waits/PWAIT_ALL_COMPONENTS_INITIALIZED
                                N'PWAIT_DIRECTLOGCONSUMER_GETNEXT', -- https://www.sqlskills.com/help/waits/PWAIT_DIRECTLOGCONSUMER_GETNEXT
                                N'QDS_PERSIST_TASK_MAIN_LOOP_SLEEP', -- https://www.sqlskills.com/help/waits/QDS_PERSIST_TASK_MAIN_LOOP_SLEEP
                                N'QDS_ASYNC_QUEUE', -- https://www.sqlskills.com/help/waits/QDS_ASYNC_QUEUE
                                N'QDS_CLEANUP_STALE_QUERIES_TASK_MAIN_LOOP_SLEEP', -- https://www.sqlskills.com/help/waits/QDS_CLEANUP_STALE_QUERIES_TASK_MAIN_LOOP_SLEEP
                                N'QDS_SHUTDOWN_QUEUE', -- https://www.sqlskills.com/help/waits/QDS_SHUTDOWN_QUEUE
                                N'REDO_THREAD_PENDING_WORK', -- https://www.sqlskills.com/help/waits/REDO_THREAD_PENDING_WORK
                                N'REQUEST_FOR_DEADLOCK_SEARCH', -- https://www.sqlskills.com/help/waits/REQUEST_FOR_DEADLOCK_SEARCH
                                N'RESOURCE_QUEUE', -- https://www.sqlskills.com/help/waits/RESOURCE_QUEUE
                                N'SERVER_IDLE_CHECK', -- https://www.sqlskills.com/help/waits/SERVER_IDLE_CHECK
                                N'SLEEP_BPOOL_FLUSH', -- https://www.sqlskills.com/help/waits/SLEEP_BPOOL_FLUSH
                                N'SLEEP_DBSTARTUP', -- https://www.sqlskills.com/help/waits/SLEEP_DBSTARTUP
                                N'SLEEP_DCOMSTARTUP', -- https://www.sqlskills.com/help/waits/SLEEP_DCOMSTARTUP
                                N'SLEEP_MASTERDBREADY', -- https://www.sqlskills.com/help/waits/SLEEP_MASTERDBREADY
                                N'SLEEP_MASTERMDREADY', -- https://www.sqlskills.com/help/waits/SLEEP_MASTERMDREADY
                                N'SLEEP_MASTERUPGRADED', -- https://www.sqlskills.com/help/waits/SLEEP_MASTERUPGRADED
                                N'SLEEP_MSDBSTARTUP', -- https://www.sqlskills.com/help/waits/SLEEP_MSDBSTARTUP
                                N'SLEEP_SYSTEMTASK', -- https://www.sqlskills.com/help/waits/SLEEP_SYSTEMTASK
                                N'SLEEP_TASK', -- https://www.sqlskills.com/help/waits/SLEEP_TASK
                                N'SLEEP_TEMPDBSTARTUP', -- https://www.sqlskills.com/help/waits/SLEEP_TEMPDBSTARTUP
                                N'SNI_HTTP_ACCEPT', -- https://www.sqlskills.com/help/waits/SNI_HTTP_ACCEPT
                                N'SP_SERVER_DIAGNOSTICS_SLEEP', -- https://www.sqlskills.com/help/waits/SP_SERVER_DIAGNOSTICS_SLEEP
                                N'SQLTRACE_BUFFER_FLUSH', -- https://www.sqlskills.com/help/waits/SQLTRACE_BUFFER_FLUSH
                                N'SQLTRACE_INCREMENTAL_FLUSH_SLEEP', -- https://www.sqlskills.com/help/waits/SQLTRACE_INCREMENTAL_FLUSH_SLEEP
                                N'SQLTRACE_WAIT_ENTRIES', -- https://www.sqlskills.com/help/waits/SQLTRACE_WAIT_ENTRIES
                                N'WAIT_FOR_RESULTS', -- https://www.sqlskills.com/help/waits/WAIT_FOR_RESULTS
                                N'WAITFOR', -- https://www.sqlskills.com/help/waits/WAITFOR
                                N'WAITFOR_TASKSHUTDOWN', -- https://www.sqlskills.com/help/waits/WAITFOR_TASKSHUTDOWN
                                N'WAIT_XTP_RECOVERY', -- https://www.sqlskills.com/help/waits/WAIT_XTP_RECOVERY
                                N'WAIT_XTP_HOST_WAIT', -- https://www.sqlskills.com/help/waits/WAIT_XTP_HOST_WAIT
                                N'WAIT_XTP_OFFLINE_CKPT_NEW_LOG', -- https://www.sqlskills.com/help/waits/WAIT_XTP_OFFLINE_CKPT_NEW_LOG
                                N'WAIT_XTP_CKPT_CLOSE', -- https://www.sqlskills.com/help/waits/WAIT_XTP_CKPT_CLOSE
                                N'XE_DISPATCHER_JOIN', -- https://www.sqlskills.com/help/waits/XE_DISPATCHER_JOIN
                                N'XE_DISPATCHER_WAIT', -- https://www.sqlskills.com/help/waits/XE_DISPATCHER_WAIT
                                N'XE_TIMER_EVENT' -- https://www.sqlskills.com/help/waits/XE_TIMER_EVENT
                            )
         AND [waiting_tasks_count] > 0 )
SELECT
    MAX([W1].[wait_type]) AS [WaitType],
    CAST(MAX([W1].[WaitS]) AS DECIMAL(16, 2)) AS [Wait_S],
    CAST(MAX([W1].[ResourceS]) AS DECIMAL(16, 2)) AS [Resource_S],
    CAST(MAX([W1].[SignalS]) AS DECIMAL(16, 2)) AS [Signal_S],
    MAX([W1].[WaitCount]) AS [WaitCount],
    CAST(MAX([W1].[Percentage]) AS DECIMAL(5, 2)) AS [Percentage],
    CAST(( MAX([W1].[WaitS]) / MAX([W1].[WaitCount])) AS DECIMAL(16, 4)) AS [AvgWait_S],
    CAST(( MAX([W1].[ResourceS]) / MAX([W1].[WaitCount])) AS DECIMAL(16, 4)) AS [AvgRes_S],
    CAST(( MAX([W1].[SignalS]) / MAX([W1].[WaitCount])) AS DECIMAL(16, 4)) AS [AvgSig_S],
    CAST('https://www.sqlskills.com/help/waits/' + MAX([W1].[wait_type]) AS XML) AS [Help/Info URL]
FROM
    [Waits] AS [W1]
    INNER JOIN [Waits] AS [W2] ON [W2].[RowNum] <= [W1].[RowNum]
GROUP BY
    [W1].[RowNum]
HAVING
    SUM([W2].[Percentage]) - MAX([W1].[Percentage]) < 95; -- percentage threshold
GO
Result: (much “cleaner”, right?”
To make your life easier, I will list some common events and their possible causes below:
- ASYNC_NETWORK_IO / NETWORKIO: The wait networkio (SQL 2000) and async_network_io (SQL 2005+) events can point to network-related problems (rarely), but can often indicate that a client application is not processing SQL Server results quickly enough. This event usually appears in RBAR (Row-By-Agonizing-Row) cases.
- CXPACKET: Event generally linked to the execution of queries using parallel processing, it may indicate that a thread has already completed its processing and is waiting for the other threads in the process to complete the execution. If this event has a very high wait_time, it may be interesting to review the event settings. MAXDOP, evaluate whether the hint OPTION(MAXDOP x) can be useful in some queries, reevaluate the indexes used by the queries that consume the most disk (probably those that are using parallelism) and try to ensure that sargable arguments are being used.
- DTC: This wait event is not local. When using Microsoft Distributed Transaction Coordinator (MS-DTC), a transaction is opened on multiple systems at the same time and the transaction is only completed when it is executed on all of those systems.
- OLEDB: This wait event indicates that the process has made a call to an OLEDB provider and is waiting for that process to call the target server and return data. This event is also generated when we execute commands on other instances using Linked Servers (remote calls), BULK INSERT commands and FULLTEXT-SEARCH queries. There is nothing to do on the local instance, but in cases of remote calls to other instances, you can analyze the target instance and try to identify the reason for the delay in processing and returning data.
- PAGEIOLATCH_*: This event occurs when SQL Server is waiting to read data on disk/storage from pages that are not in memory, generating disk contention. To reduce this I/O event, you can try to increase disk speed (to reduce this time), add more memory (to allocate more pages) or try to identify and tune those queries that are generating this I/O event.
A very common cause that generates this event is the lack of optimal indexes for this particular query, which can be resolved by creating new indexes with the help of Missing Index DMVs to avoid Scan operations (Read the post Understanding how indexes work in SQL Server to understand better about this).
- PAGELATCH_*: The most common causes for this event are tempdb contention on heavily overloaded instances. The wait PAGELATCH_UP generally occurs when multiple threads are trying to access the same bitmap, while the PAGELATCH_EX event occurs when threads are trying to insert data into the same disk page, and the PAGELATCH_SH event indicates that some thread is trying to read data from a page that is being modified
- IO_COMPLETION: This wait event occurs when SQL Server is waiting for I/O operations to complete processing, which are not readings of indexes or data on disk, but rather, readings of disk bitmap allocations (GAM, SGAM, PFS), transaction log, writing sort buffers to disk, reading VLF headers from the transaction log, reading/writing merge join/eager spools to disk, etc.
This event is normal to happen, as it usually appears right before starting an operation that requires I/O, but it can be a problem if the wait time is very high and your list of biggest waits includes ASYNC_IO_COMPLETION, LOGMGR, WRITELOG or PAGEIOLATCH_*.
When there is an I/O problem on the instance, the SQL Server log usually displays messages saying “I/O requests are taking longer than
To address this issue, look for queries that have very high disk read/write times, including the Disk avg counters. read time, Disk avg. write time, Avg. disk queue length, Buffer cache hit ratio, Buffer free pages, Buffer page life expectancy and Machine: memory used
- SOS_SCHEDULER_YIELD: This event occurs when SqlOS (SOS) is waiting for more CPU resources to finish processing, which may indicate that the server is experiencing CPU overload and is not able to process all the tasks that are requested. However, this does not always indicate that it is a general problem with the instance, as it may indicate that a specific query is requiring more CPU.
If your query has some parallelism inhibitors (Ex: HINT MAXDOP(1), serial UDF functions, system table queries, etc.), it can cause processing to be done using only 1 CPU Core, meaning that the SOS_SCHEDULER_YIELD event can be generated, even if the server has several cores available for processing and with low CPU usage on the instance.
To try to identify this, try to find the queries that are consuming the most CPU and/or whose CPU time is less than the execution time (when parallelism occurs, sometimes the query consumes 10s of CPU and executes in 2s, which means it has been parallelized across multiple CPU cores)
- WRITELOG: When a transaction is waiting for the WRITELOG event, this means that it is waiting for SQL Server to capture data from the log cache and write it to disk (in the transaction log). As this operation involves writing to disk, which is generally a much slower operation than memory access or CPU processing, this type of event can be quite common in instances that do not have a very fast disk. If you encounter this event a lot, an alternative to reducing this wait is to use the feature Delayed Durability, available starting with SQL Server 2014
- LCK*: A very common event that is not directly related to performance, this event occurs when a transaction is altering an object and it places a lock on that object, to prevent any other transaction from being able to modify or access the data while it is processing. Therefore, if another transaction tries to access this object, it will have to wait for this lock to be removed to continue processing, generating precisely this wait event. This is often confused with a performance problem, because the query will actually take as long as necessary until the lock is released and it can process its data, causing the user to have a feeling of slowness in the environment, especially if it is a query that is heavily used in the system. In this case, it is appropriate to analyze the session that is generating the lock to assess why it is taking so long to process and release the object.
To delve deeper into the analysis of wait events, I recommend reading the posts below:
– https://www.sqlskills.com/help/sql-server-performance-tuning-using-wait-statistics/
– https://www.sqlskills.com/blogs/erin/the-accidental-dba-day-25-of-30-wait-statistics-analysis/
– Wait statistics, or please tell me where it hurts
– List of common wait types
– Using Wait Stats to Find Why SQL Server is Slow
– What is the most worrying wait type?
How to identify long-running queries using Extended Event (XE)
View content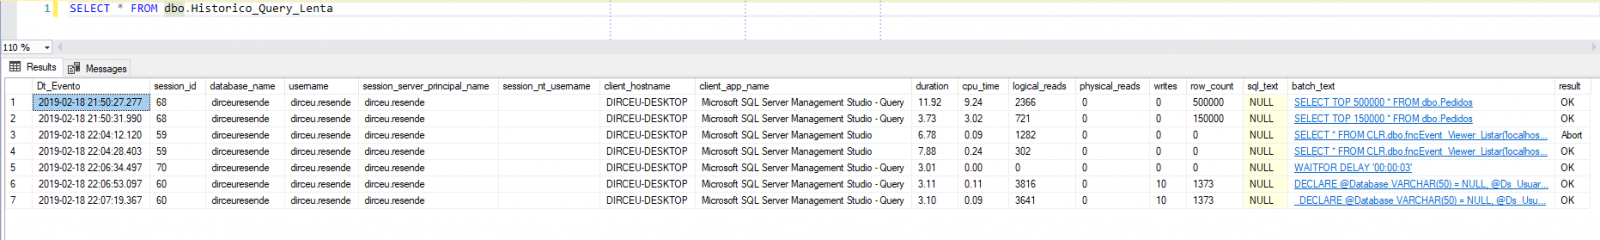
This way, together with the analysis of wait events, we can begin the work of identifying possible attackers to CPU, Disk or execution time consumption.
How to identify long-running queries using Trace
View content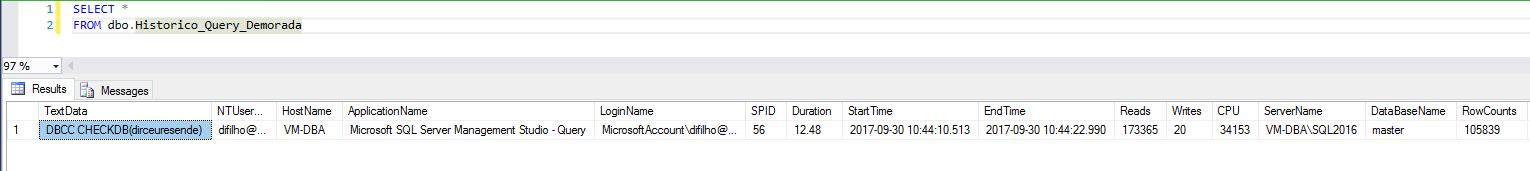
This way, together with the analysis of wait events, we can begin the work of identifying possible attackers to CPU, Disk or execution time consumption.
How to identify “heavy” ad-hoc queries with DMV’s
View contentUsing the database statistics and DMV sys.dm_exec_query_stats, we can consult the queries that were executed on the instance and apply the filters and ordering of execution time, disk and CPU, allowing us to identify the number of times this query was executed, average execution time and time of the last execution, in addition to informing the complete query (text) that is being executed and also the specific section of this object/query (TSQL) of these collected statistics and also the execution plan of this query.
Query used (Ordering by execution time):
SELECT TOP 100
    DB_NAME(C.[dbid]) as [database],
    B.[text],
    (SELECT CAST(SUBSTRING(B.[text], (A.statement_start_offset/2)+1,
        (((CASE A.statement_end_offset
            WHEN -1 THEN DATALENGTH(B.[text])
            ELSE A.statement_end_offset
        END) - A.statement_start_offset)/2) + 1) AS NVARCHAR(MAX)) FOR XML PATH(''), TYPE) AS [TSQL],
    C.query_plan,

    A.last_execution_time,
    A.execution_count,

    A.total_elapsed_time / 1000 AS total_elapsed_time_ms,
    A.last_elapsed_time / 1000 AS last_elapsed_time_ms,
    A.min_elapsed_time / 1000 AS min_elapsed_time_ms,
    A.max_elapsed_time / 1000 AS max_elapsed_time_ms,
    ((A.total_elapsed_time / A.execution_count) / 1000) AS avg_elapsed_time_ms,

    A.total_worker_time / 1000 AS total_worker_time_ms,
    A.last_worker_time / 1000 AS last_worker_time_ms,
    A.min_worker_time / 1000 AS min_worker_time_ms,
    A.max_worker_time / 1000 AS max_worker_time_ms,
    ((A.total_worker_time / A.execution_count) / 1000) AS avg_worker_time_ms,

    A.total_physical_reads,
    A.last_physical_reads,
    A.min_physical_reads,
    A.max_physical_reads,

    A.total_logical_reads,
    A.last_logical_reads,
    A.min_logical_reads,
    A.max_logical_reads,

    A.total_logical_writes,
    A.last_logical_writes,
    A.min_logical_writes,
    A.max_logical_writes
FROM
    sys.dm_exec_query_stats A
    CROSS APPLY sys.dm_exec_sql_text(A.[sql_handle]) B
    OUTER APPLY sys.dm_exec_query_plan (A.plan_handle) AS C
ORDER BY
    A.total_elapsed_time DESC
Result:
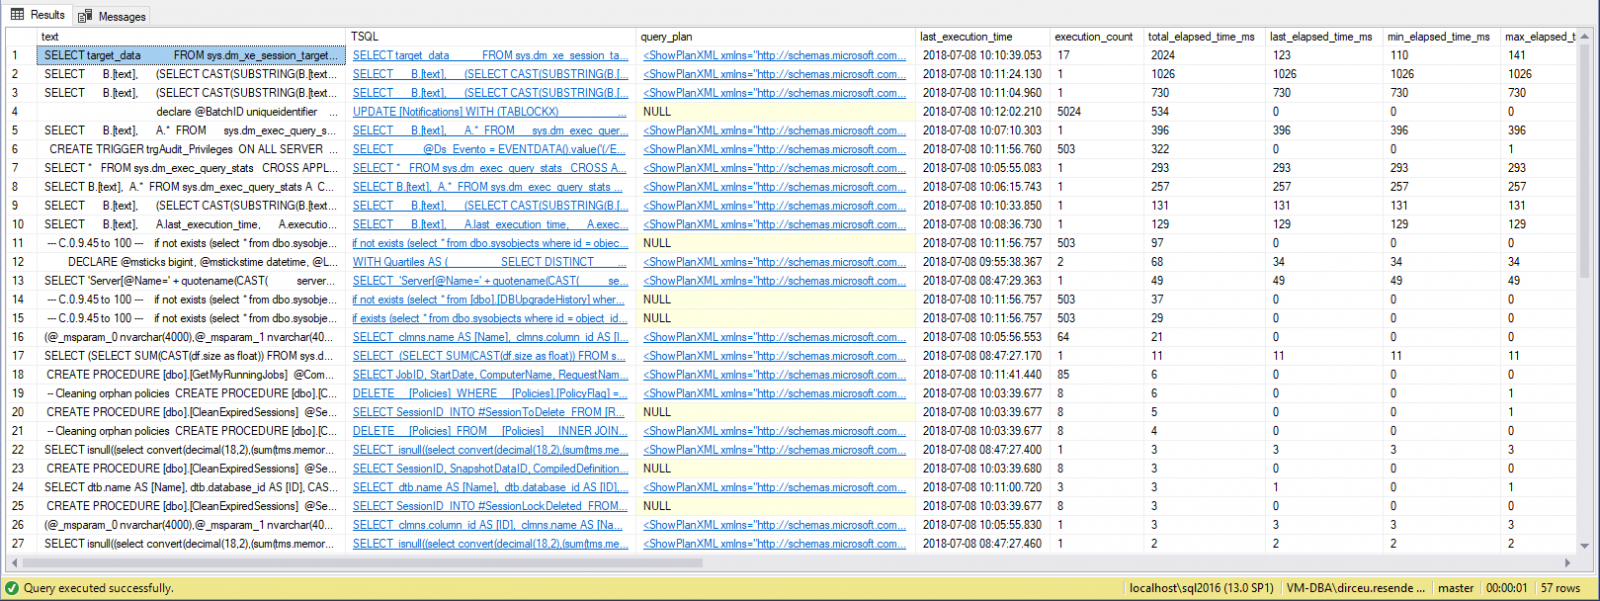
As you can see, in the example above I filtered the data to return the queries that take longer to execute, but you can order by the column you want, being able to refine your query according to your environment and needs, along with the analysis of wait events.
It is worth remembering that, as we are consulting bank statistics data, if the service is restarted, this data will be lost. For this reason, I suggest creating a routine that collects this data from time to time and stores it in a physical table, so when this happens, you can continue your analysis where you left off and don't have to wait for hours or days to have data to continue analyzing.
Stored Procedure to store Ad-hoc queries from all databases:
USE [dirceuresende]
GO

CREATE PROCEDURE [dbo].[stpCarga_Historico_Execucao_Consultas]
AS BEGIN


    IF (OBJECT_ID('dirceuresende.dbo.Historico_Execucao_Consultas') IS NULL)
    BEGIN

        -- DROP TABLE dirceuresende.dbo.Historico_Execucao_Consultas
        CREATE TABLE dirceuresende.dbo.Historico_Execucao_Consultas
        (
            Id_Coleta BIGINT IDENTITY(1,1) NOT NULL PRIMARY KEY CLUSTERED,
            Dt_Coleta datetime NOT NULL,
            [database] sys.sysname NOT NULL,
            [text] NVARCHAR(MAX) NULL,
            [TSQL] XML NULL,
            [query_plan] XML NULL,
            last_execution_time datetime NULL,
            execution_count bigint NOT NULL,
            total_elapsed_time_ms bigint NULL,
            last_elapsed_time_ms bigint NULL,
            min_elapsed_time_ms bigint NULL,
            max_elapsed_time_ms bigint NULL,
            avg_elapsed_time_ms bigint NULL,
            total_worker_time_ms bigint NULL,
            last_worker_time_ms bigint NULL,
            min_worker_time_ms bigint NULL,
            max_worker_time_ms bigint NULL,
            avg_worker_time_ms bigint NULL,
            total_physical_reads bigint NOT NULL,
            last_physical_reads bigint NOT NULL,
            min_physical_reads bigint NOT NULL,
            max_physical_reads bigint NOT NULL,
            total_logical_reads bigint NOT NULL,
            last_logical_reads bigint NOT NULL,
            min_logical_reads bigint NOT NULL,
            max_logical_reads bigint NOT NULL,
            total_logical_writes bigint NOT NULL,
            last_logical_writes bigint NOT NULL,
            min_logical_writes bigint NOT NULL,
            max_logical_writes bigint NOT NULL
        ) WITH(DATA_COMPRESSION=PAGE)

        CREATE INDEX SK01_Historico_Execucao_Consultas ON dirceuresende.dbo.Historico_Execucao_Consultas(Dt_Coleta, [database])

    END


    DECLARE
        @Dt_Referencia DATETIME = GETDATE(),
        @Query VARCHAR(MAX)


    SET @Query = '
IF (''?'' NOT IN (''master'', ''model'', ''msdb'', ''tempdb''))
BEGIN

    INSERT INTO dirceuresende.dbo.Historico_Execucao_Consultas
    SELECT
        ''' + CONVERT(VARCHAR(19), @Dt_Referencia, 120) + ''' AS Dt_Coleta,
        ''?'' AS [database],
        B.[text],
        (SELECT CAST(SUBSTRING(B.[text], (A.statement_start_offset/2)+1, (((CASE A.statement_end_offset WHEN -1 THEN DATALENGTH(B.[text]) ELSE A.statement_end_offset END) - A.statement_start_offset)/2) + 1) AS NVARCHAR(MAX)) FOR XML PATH(''''),TYPE) AS [TSQL],
        C.query_plan,

        A.last_execution_time,
        A.execution_count,

        A.total_elapsed_time / 1000 AS total_elapsed_time_ms,
        A.last_elapsed_time / 1000 AS last_elapsed_time_ms,
        A.min_elapsed_time / 1000 AS min_elapsed_time_ms,
        A.max_elapsed_time / 1000 AS max_elapsed_time_ms,
        ((A.total_elapsed_time / A.execution_count) / 1000) AS avg_elapsed_time_ms,

        A.total_worker_time / 1000 AS total_worker_time_ms,
        A.last_worker_time / 1000 AS last_worker_time_ms,
        A.min_worker_time / 1000 AS min_worker_time_ms,
        A.max_worker_time / 1000 AS max_worker_time_ms,
        ((A.total_worker_time / A.execution_count) / 1000) AS avg_worker_time_ms,

        A.total_physical_reads,
        A.last_physical_reads,
        A.min_physical_reads,
        A.max_physical_reads,

        A.total_logical_reads,
        A.last_logical_reads,
        A.min_logical_reads,
        A.max_logical_reads,

        A.total_logical_writes,
        A.last_logical_writes,
        A.min_logical_writes,
        A.max_logical_writes
    FROM
        [?].sys.dm_exec_query_stats A
        CROSS APPLY [?].sys.dm_exec_sql_text(A.[sql_handle]) B
        OUTER APPLY [?].sys.dm_exec_query_plan (A.plan_handle) AS C

END'


    EXEC master.dbo.sp_MSforeachdb
        @command1 = @Query


END
GO
How to identify “heavy” procedures with DMV’s
View contentQuery used (Ordering by number of executions):
SELECT TOP 100
    B.[name] AS rotina,
    A.cached_time,
    A.last_execution_time,
    A.execution_count,

    A.total_elapsed_time / 1000 AS total_elapsed_time_ms,
    A.last_elapsed_time / 1000 AS last_elapsed_time_ms,
    A.min_elapsed_time / 1000 AS min_elapsed_time_ms,
    A.max_elapsed_time / 1000 AS max_elapsed_time_ms,
    ((A.total_elapsed_time / A.execution_count) / 1000) AS avg_elapsed_time_ms,

    A.total_worker_time / 1000 AS total_worker_time_ms,
    A.last_worker_time / 1000 AS last_worker_time_ms,
    A.min_worker_time / 1000 AS min_worker_time_ms,
    A.max_worker_time / 1000 AS max_worker_time_ms,
    ((A.total_worker_time / A.execution_count) / 1000) AS avg_worker_time_ms,

    A.total_physical_reads,
    A.last_physical_reads,
    A.min_physical_reads,
    A.max_physical_reads,

    A.total_logical_reads,
    A.last_logical_reads,
    A.min_logical_reads,
    A.max_logical_reads,

    A.total_logical_writes,
    A.last_logical_writes,
    A.min_logical_writes,
    A.max_logical_writes
FROM
    sys.dm_exec_procedure_stats                 A
    JOIN sys.objects                            B    ON  A.[object_id] = B.[object_id]
ORDER BY
    A.execution_count DESC
Result:
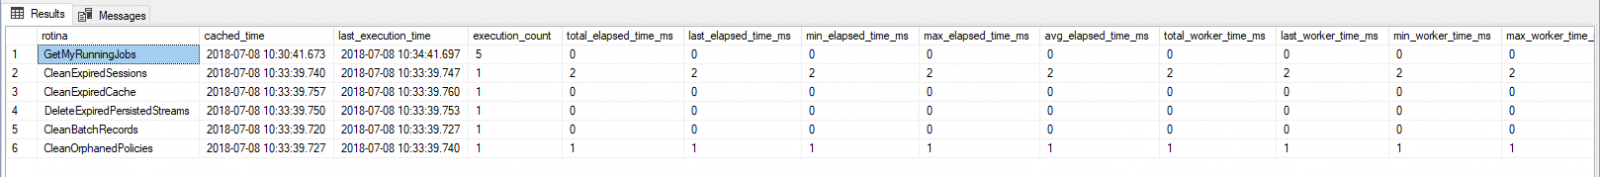
It is worth remembering that, as we are consulting bank statistics data, if the service is restarted, this data will be lost. For this reason, I suggest creating a routine that collects this data from time to time and stores it in a physical table, so when this happens, you can continue your analysis where you left off and don't have to wait for hours or days to have data to continue analyzing. If the object is changed or recompiled, a new execution plan will be generated for it and the data in this view will be reset, which reinforces the need to have this history to identify the effect of these plan changes.
Stored Procedure to store SP statistics from all databases:
USE [dirceuresende]
GO

CREATE PROCEDURE [dbo].[stpCarga_Historico_Execucao_Procedures]
AS BEGIN


    IF (OBJECT_ID('dirceuresende.dbo.Historico_Execucao_Procedures') IS NULL)
    BEGIN

        -- DROP TABLE dirceuresende.dbo.Historico_Execucao_Procedures
        CREATE TABLE dirceuresende.dbo.Historico_Execucao_Procedures (
            Id_Coleta BIGINT IDENTITY(1,1) NOT NULL PRIMARY KEY CLUSTERED,
            Dt_Coleta datetime NOT NULL,
            [database] sys.sysname NOT NULL,
            rotina sys.sysname NOT NULL,
            cached_time datetime NULL,
            last_execution_time datetime NULL,
            execution_count bigint NOT NULL,
            total_elapsed_time_ms bigint NULL,
            last_elapsed_time_ms bigint NULL,
            min_elapsed_time_ms bigint NULL,
            max_elapsed_time_ms bigint NULL,
            avg_elapsed_time_ms bigint NULL,
            total_worker_time_ms bigint NULL,
            last_worker_time_ms bigint NULL,
            min_worker_time_ms bigint NULL,
            max_worker_time_ms bigint NULL,
            avg_worker_time_ms bigint NULL,
            total_physical_reads bigint NOT NULL,
            last_physical_reads bigint NOT NULL,
            min_physical_reads bigint NOT NULL,
            max_physical_reads bigint NOT NULL,
            total_logical_reads bigint NOT NULL,
            last_logical_reads bigint NOT NULL,
            min_logical_reads bigint NOT NULL,
            max_logical_reads bigint NOT NULL,
            total_logical_writes bigint NOT NULL,
            last_logical_writes bigint NOT NULL,
            min_logical_writes bigint NOT NULL,
            max_logical_writes bigint NOT NULL
        ) WITH(DATA_COMPRESSION = PAGE)

        CREATE INDEX SK01_Historico_Execucao_Procedures ON dirceuresende.dbo.Historico_Execucao_Procedures(Dt_Coleta, [database], rotina)

    END


    DECLARE
        @Dt_Referencia DATETIME = GETDATE(),
        @Query VARCHAR(MAX)


    SET @Query = '
INSERT INTO dirceuresende.dbo.Historico_Execucao_Procedures
SELECT
    ''' + CONVERT(VARCHAR(19), @Dt_Referencia, 120) + ''' AS Dt_Coleta,
    ''?'' AS [database],
    B.name AS rotina,
    A.cached_time,
    A.last_execution_time,
    A.execution_count,

    A.total_elapsed_time / 1000 AS total_elapsed_time_ms,
    A.last_elapsed_time / 1000 AS last_elapsed_time_ms,
    A.min_elapsed_time / 1000 AS min_elapsed_time_ms,
    A.max_elapsed_time / 1000 AS max_elapsed_time_ms,
    ((A.total_elapsed_time / A.execution_count) / 1000) AS avg_elapsed_time_ms,

    A.total_worker_time / 1000 AS total_worker_time_ms,
    A.last_worker_time / 1000 AS last_worker_time_ms,
    A.min_worker_time / 1000 AS min_worker_time_ms,
    A.max_worker_time / 1000 AS max_worker_time_ms,
    ((A.total_worker_time / A.execution_count) / 1000) AS avg_worker_time_ms,

    A.total_physical_reads,
    A.last_physical_reads,
    A.min_physical_reads,
    A.max_physical_reads,

    A.total_logical_reads,
    A.last_logical_reads,
    A.min_logical_reads,
    A.max_logical_reads,

    A.total_logical_writes,
    A.last_logical_writes,
    A.min_logical_writes,
    A.max_logical_writes
FROM
    [?].sys.dm_exec_procedure_stats                 A   WITH(NOLOCK)
    JOIN [?].sys.objects                            B   WITH(NOLOCK)    ON  A.object_id = B.object_id'


    EXEC master.dbo.sp_MSforeachdb
        @command1 = @Query


END
GO
How to identify “heavy” queries with WhoIsActive
View contentUsing this SP, we can monitor the queries running on the instance and evaluate which ones are consuming the most CPU, Disk, Memory and also monitor the wait events for each query and whether any session is causing locks on the instance:

For this reason, I find it very interesting to have a routine that collects data from this Stored Procedure/View every X minutes and stores it in a physical table for X days, so that you can analyze the past in case of a slowdown and you want to identify exactly what was being executed at a given moment and how the resource consumption (CPU, disk, memory, wait events, etc.) of each such query was.
Having this level of information can be very useful when investigating performance problems (and even other types of problems as well).
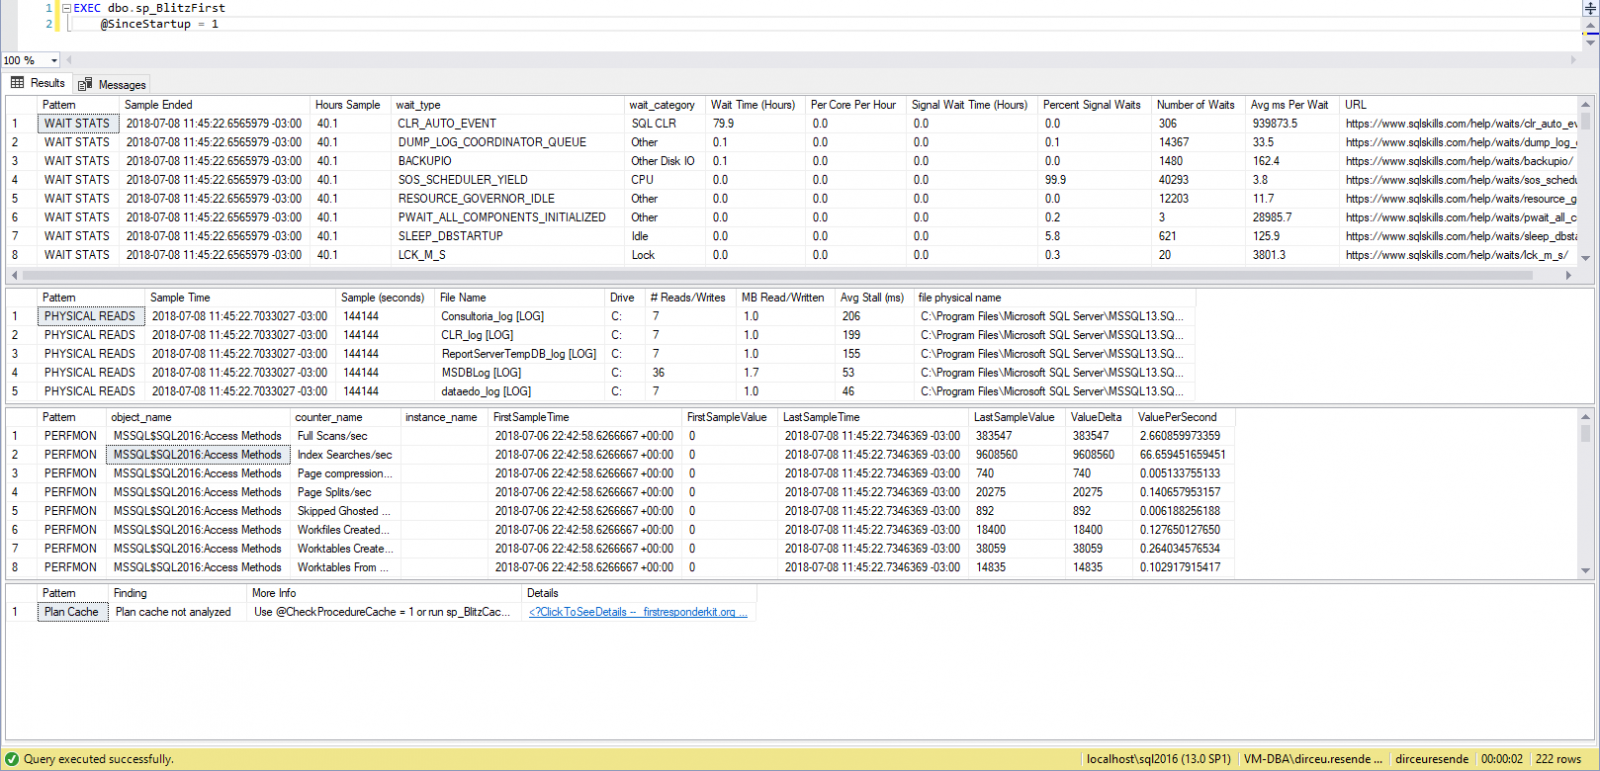
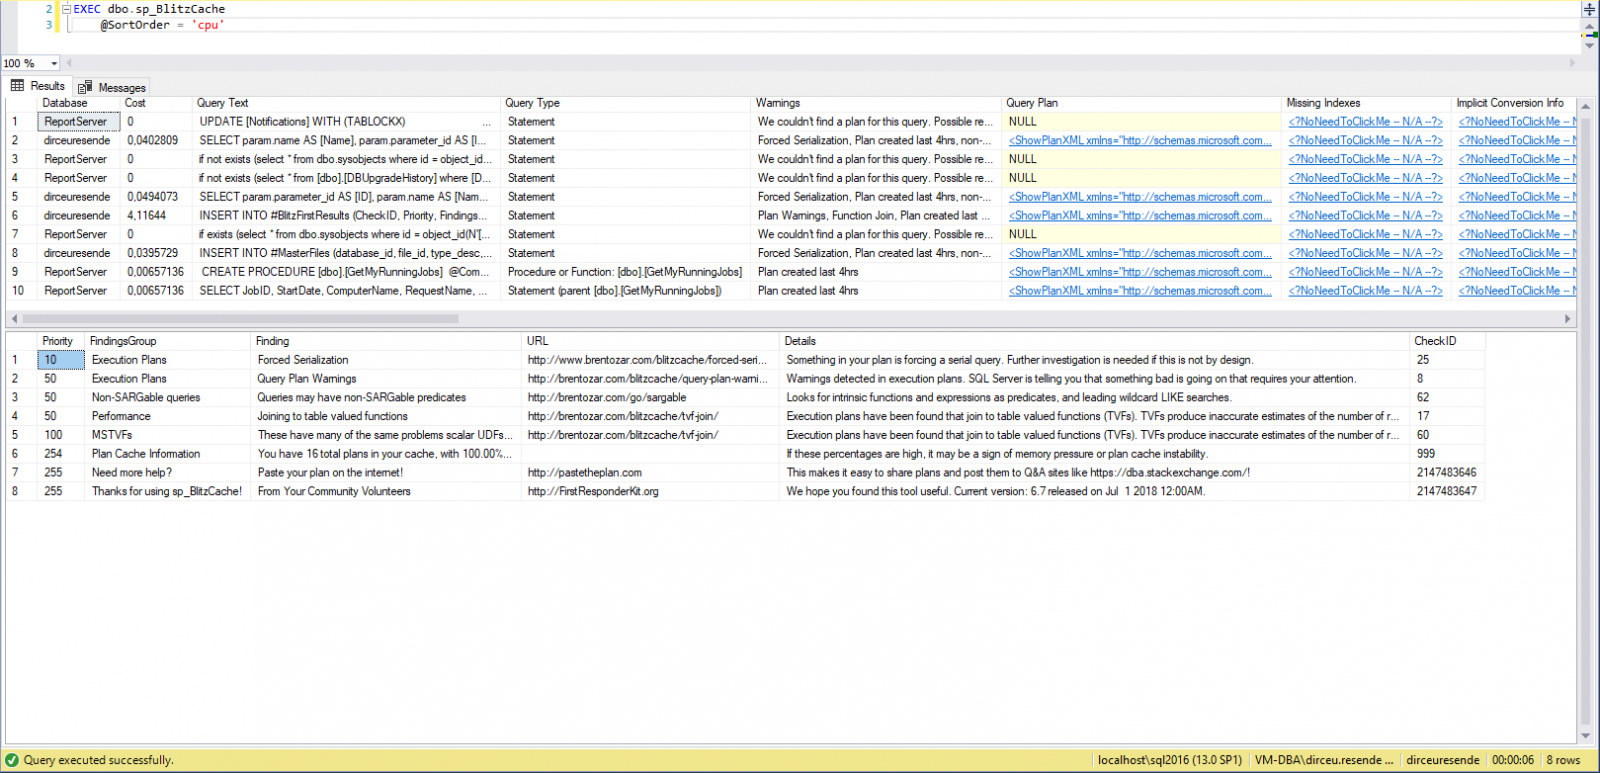
How to identify “heavy” queries with sp_BlitzFirst
View contentsp_BlitzCache, on the other hand, performs several checks on the execution plans cached in the instance and looks for situations that normally lead to poor performance during execution, such as missing indexes (Missing index), implicit conversions, etc.
Example of running sp_BlitzFirst (Instance overview):
Example of sp_BlitzCache execution (Analyzes cached execution plans):
See how it works in practice:
Download SP’s on this link here.
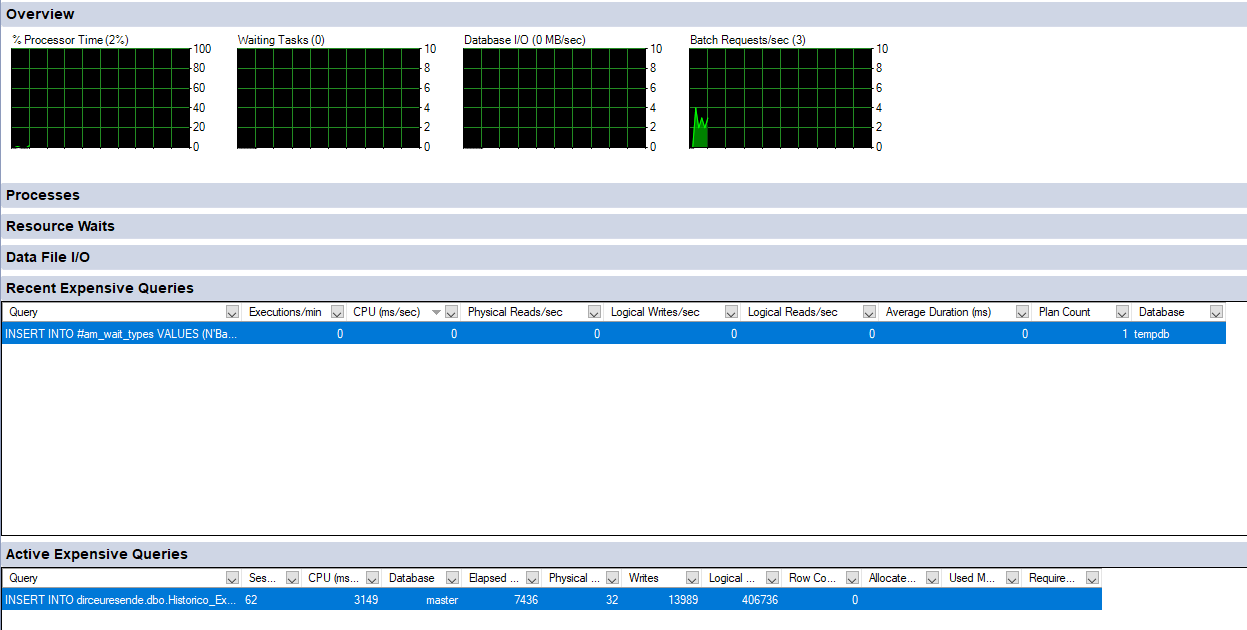
How to identify “heavy” queries with Management Studio (SSMS)
View content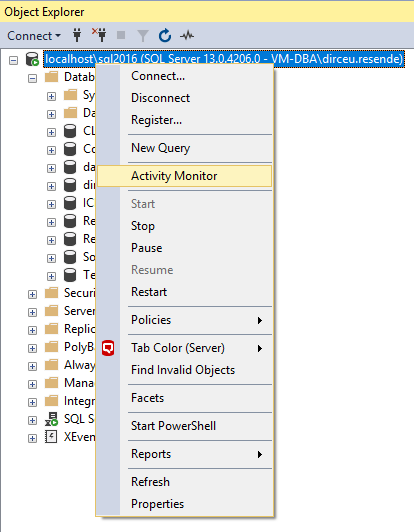
And analyzing its results, where it already shows some queries that it thinks consume a lot of instance resources:
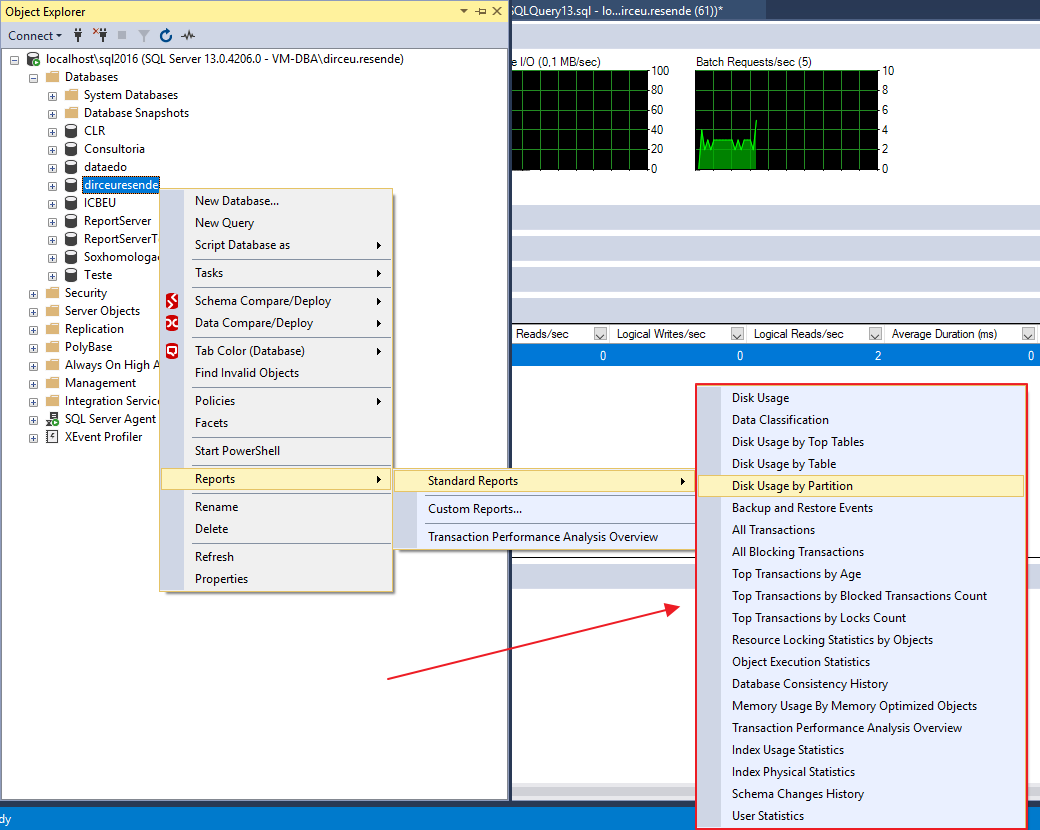
SSMS also offers several ready-made reports, ranging from measuring disk space used by each table, to performance reports (Index Usage Statistics, Index Physical Statistics and Object Execution Statistics):
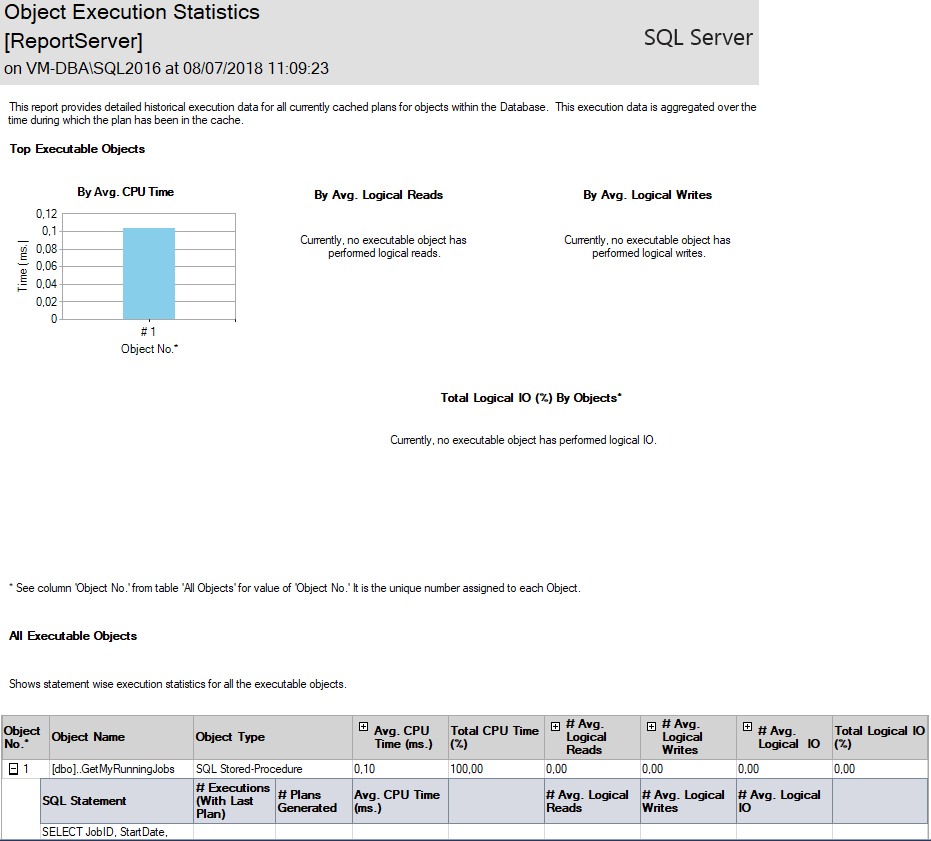
Object Execution Statistics Report:
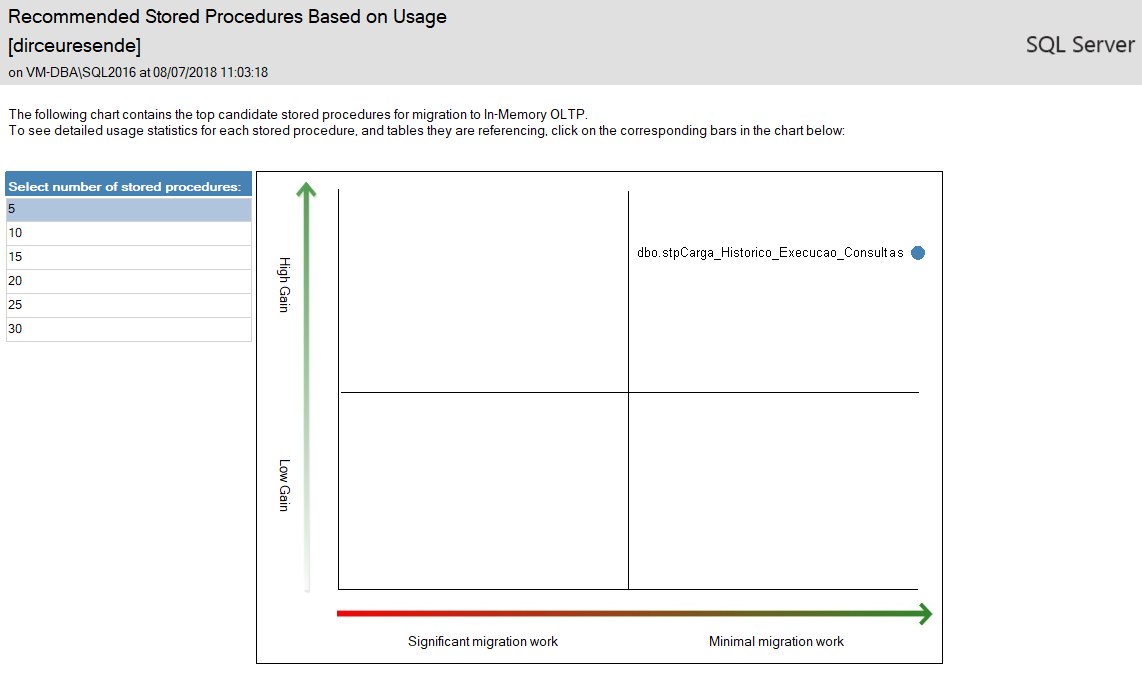
SSMS even has reports helping to migrate physical objects (Tables and Stored procedures) to in-memory objects (In-Memory OLTP), through the “Transaction Performance Analysis Overview” report:
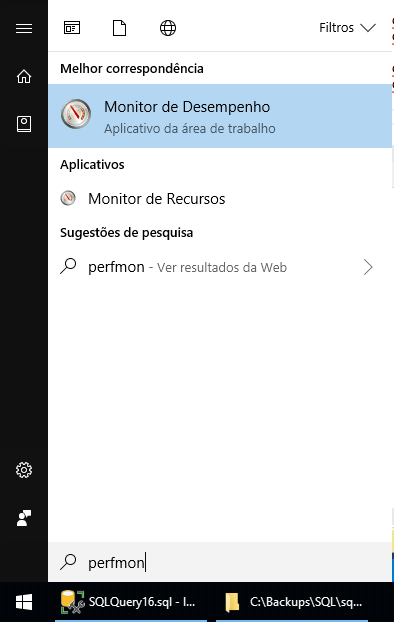
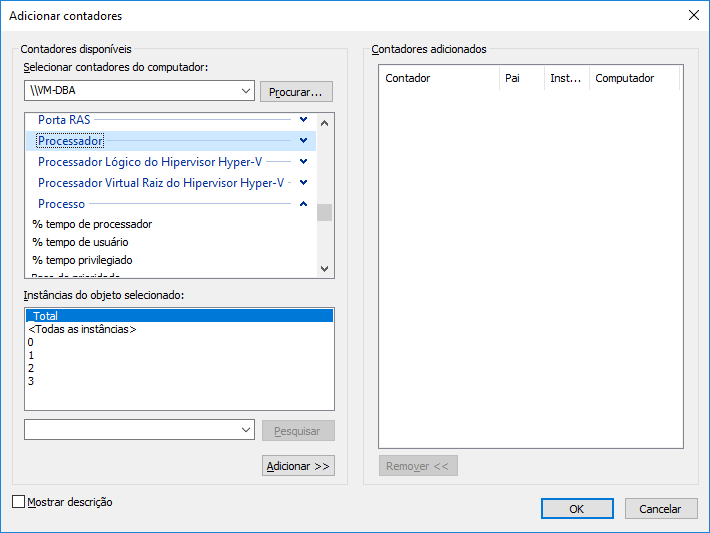
How to identify “heavy” queries with Perfmon
View contentAccessing Perfmon:
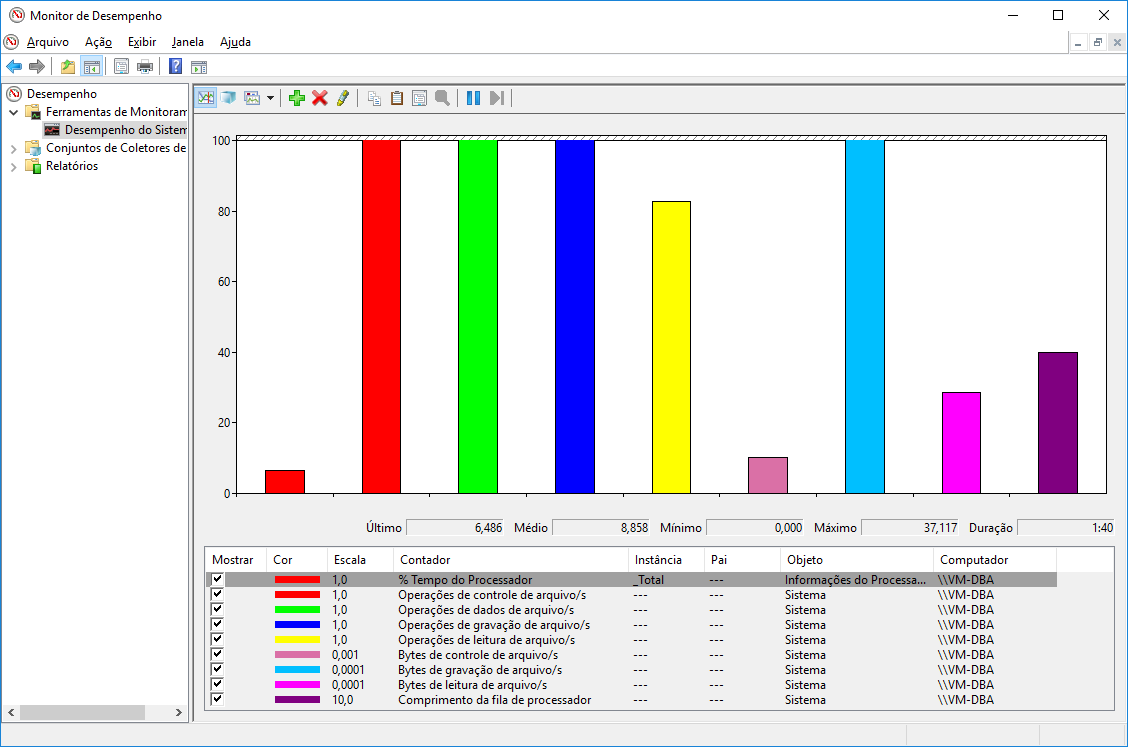
Graphic view:
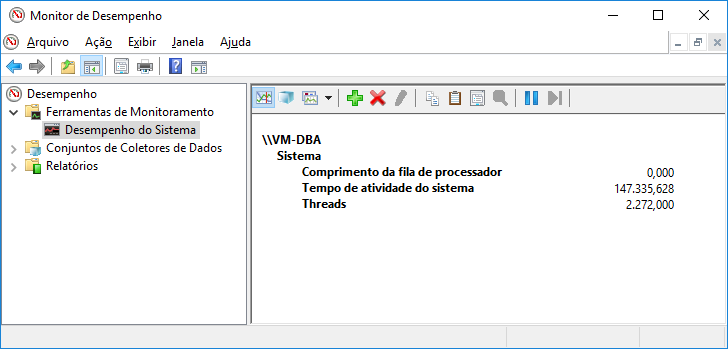
Textual view:
Types of counters:
Video of MVP Osanam Giordane about Perfmon:
In the article Perfmon counters, from MCM Fabricio Catae, he presents us with a list of counters that are usually used to monitor SQL Server instances, which are:
Logical Disk
- Avg Disk Sec/Read
- Avg Disk Sec/Transfer
- Avg Disk Sec/Write
- Current Disk Queue Length
- Disk Bytes/sec
- Disk Read Bytes/sec
- Disk Write Bytes/sec
- Disk Reads/sec
- Disk Transfers/sec
- Disk Writes/sec
memory
- %Committed Bytes In Use
- AvailableMB
- Committed Bytes
- Free System Page Table Entries
- Pool Nonpaged Bytes
- Pool Paged Bytes
Network Interfaces
- Bytes Received/sec
- Bytes Sent/sec
- Total Bytes/sec
Processor
- %Processor Time
- %Privileged Time
System
- Context Switches/sec
- Exception Dispatches/sec
- Processor Queue Length
- System Calls/sec
Additionally, use these counters per SQL instance:
Buffer Manager
- Database pages
- Free list stalls/sec
- Free pages
- Lazy writes/sec
- Page life expectancy
- Page lookups/sec
- Page reads/sec
- Readhead pages/sec
- Stolen pages
- Target pages
- Total pages
General Statistics
- Connection Reset/sec
- Logins/sec
- Logouts/sec
- User Connections
SQL Statistics
- Batch Requests/sec
- Safe Auto-Params/sec
- Forced Parameterizations/sec
- SQL Compilations/sec
- SQL Re-Compilations/sec
To dive deeper into monitoring SQL Server instances using Perfmon, be sure to check out the Ninja Perfmon Posts.
How to identify “heavy” queries using monitoring software
View contentThat's it, folks!
I hope you enjoyed this post and see you next time!

Comments (0)
Loading comments...