Hey guys!
In this article I would like to share with you how to identify and collect information from long-running queries using Extended Events (XE), in an article very similar to the SQL Server – How to identify and collect information from long-running queries using Trace (SQL Server Profiler), which uses Profiler (Trace) technology.
What motivated me to write this article was that Profiler is a feature that has been marked as deprecated for a long time, it is a much older technology and the code is not friendly or readable at all. So, thinking about bringing a more modern and intuitive solution to you, I decided to share this solution using XE.
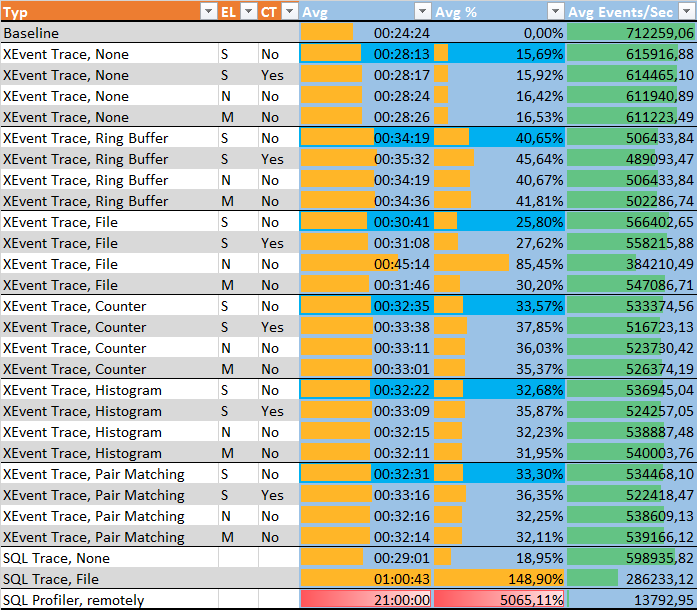
If everything I said above is still not enough for you to change your Profiler to XE, know that the overhead of XE is MUCH lower than that of events using Trace, as we can find in the articles below:
- Comparing Extended Events vs SQL Trace – or why SQL Trace & Profiler are just a thing of the past
- Performance overhead of tracing with Extended Event targets vs SQL Trace under CPU Load
- Measuring “Observer Overhead” of SQL Trace vs. Extended Events
Step 1 – Activate Extended Event on the Server (SQL 2012+)
In order to start monitoring the commands that are executed on the instance, let's enable Extended Event by capturing the command events. sqlserver.sql_batch_completed. It could even be sqlserver.sp_statement_completed and/or sqlserver.sql_statement_completed, but it would only capture the parts of an ad-hoc or SP query that have passed the duration time limit. In this article, my objective is to capture the entire SP or batch that has passed the time limit and then analyze it to find out which statement is taking longer.
-- Apaga a sessão, caso ela já exista
IF ((SELECT COUNT(*) FROM sys.server_event_sessions WHERE [name] = 'Query Lenta') > 0) DROP EVENT SESSION [Query Lenta] ON SERVER
GO

-- Cria o Extended Event no servidor, configurado para iniciar automaticamente quando o serviço do SQL é iniciado
CREATE EVENT SESSION [Query Lenta] ON SERVER
ADD EVENT sqlserver.sql_batch_completed (
    ACTION (
        sqlserver.session_id,
        sqlserver.client_app_name,
        sqlserver.client_hostname,
        sqlserver.database_name,
        sqlserver.username,
        sqlserver.session_nt_username,
        sqlserver.session_server_principal_name,
        sqlserver.sql_text
    )
    WHERE
        duration > (3000000) -- 3 segundos
)
ADD TARGET package0.event_file (
    SET filename=N'C:\Traces\Query Lenta',
    max_file_size=(10),
    max_rollover_files=(10)
)
WITH (STARTUP_STATE=ON)
GO

-- Ativa o Extended Event
ALTER EVENT SESSION [Query Lenta] ON SERVER STATE = START
GO
For this monitoring, I set the time limit for capturing queries to be 3 seconds. If this time has been reached or passed, the query is logged in our monitoring. I set the destination for the collected data to “C:\Traces\Query Slow”, with a maximum size of 10 MB of data and a maximum of 10 files. Because the rollout is configured, the files will always keep the most recent data, so we don't need to worry about purging the data or the files growing too large.
Step 1 – Activate Extended Event on the Server (SQL 2008)
If you are still using SQL Server 2008 in your environment (it's past time to migrate huh... support ends in July/2019), you will notice that when trying to create the Extended Events described above, you will receive the error message below:
The event name, “sqlserver.sql_batch_completed”, is invalid, or the object could not be found
This occurs because in SQL Server 2008, this event was not yet supported, as we can see using the query below:
SELECT
    p.[name] package_name,
    o.[name] event_name,
    c.[name] event_field,
    c.[type_name] field_type,
    c.column_type column_type
FROM
    sys.dm_xe_objects o
    JOIN sys.dm_xe_packages p ON o.package_guid = p.[guid]
    JOIN sys.dm_xe_object_columns c ON o.[name] = c.[object_name]
WHERE
    o.object_type = 'event'
    AND o.[name] LIKE '%_completed%'
ORDER BY
    package_name,
    event_name
Result:
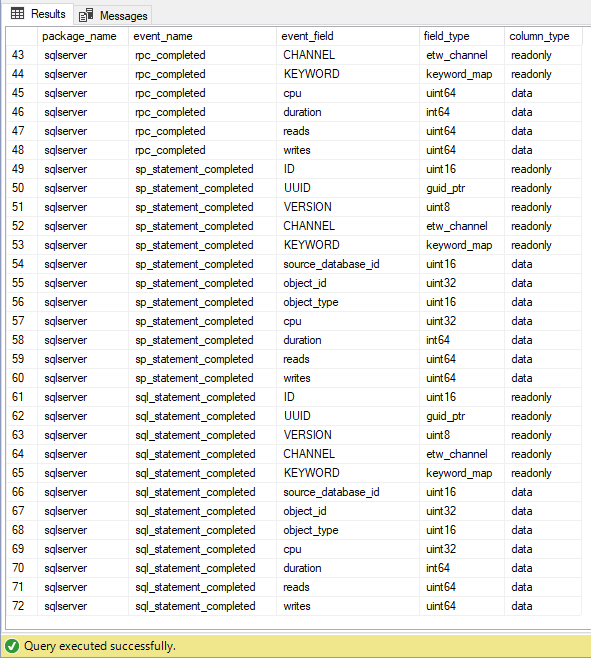
In other words, if we want to implement a slow query monitoring solution using Extended Events, we will have to look for other types of events, and for this case, I will use the sp_statement_completed and sql_statement_completed methods:
-- Apaga a sessão, caso ela já exista
IF ((SELECT COUNT(*) FROM sys.server_event_sessions WHERE [name] = 'Query Lenta') > 0) DROP EVENT SESSION [Query Lenta] ON SERVER
GO

-- Cria o Extended Event no servidor, configurado para iniciar automaticamente quando o serviço do SQL é iniciado
CREATE EVENT SESSION [Query Lenta] ON SERVER
ADD EVENT sqlserver.sp_statement_completed (
    ACTION (
        sqlserver.session_id,
        sqlserver.client_app_name,
        sqlserver.client_hostname,
        sqlserver.username,
        sqlserver.database_id,
        sqlserver.session_nt_username,
        sqlserver.sql_text
    )
    WHERE
        duration > (3000000) -- 3 segundos
),
ADD EVENT sqlserver.sql_statement_completed (
    ACTION (
        sqlserver.session_id,
        sqlserver.client_app_name,
        sqlserver.client_hostname,
        sqlserver.username,
        sqlserver.database_id,
        sqlserver.session_nt_username,
        sqlserver.sql_text
    )
    WHERE
        duration > (3000000) -- 3 segundos
)
ADD TARGET package0.asynchronous_file_target (
    SET filename=N'C:\Traces\Query Lenta 2008.xel',
    max_file_size=(100),
    max_rollover_files=(1)
)
WITH (STARTUP_STATE=ON)
GO

-- Ativa o Extended Event
ALTER EVENT SESSION [Query Lenta] ON SERVER STATE = START
GO
Unlike the method I used previously (sql_batch_completed), which measures the execution time of the entire batch, these 2 types of events will capture query sections or Stored Procedures that exceed the time limit, that is, if you have a Stored Procedure that takes 40s to execute and none of the statements exceed 3 seconds, this SP will not be monitored.
Step 2 – Create the Data History Table
To store the data collected by our monitoring, we will create a physical table that we will use to enter the data and, later, to consult the collected data whenever necessary.
SQL Server 2012+
CREATE TABLE dbo.Historico_Query_Lenta (
    [Dt_Evento] DATETIME,
    [session_id] INT,
    [database_name] VARCHAR(128),
    [username] VARCHAR(128),
    [session_server_principal_name] VARCHAR(128),
    [session_nt_username] VARCHAR(128),
    [client_hostname] VARCHAR(128),
    [client_app_name] VARCHAR(128),
    [duration] DECIMAL(18, 2),
    [cpu_time] DECIMAL(18, 2),
    [logical_reads] BIGINT,
    [physical_reads] BIGINT,
    [writes] BIGINT,
    [row_count] BIGINT,
    [sql_text] XML,
    [batch_text] XML,
    [result] VARCHAR(100)
) WITH(DATA_COMPRESSION=PAGE)
GO

CREATE CLUSTERED INDEX SK01_Historico_Query_Lenta ON dbo.Historico_Query_Lenta (Dt_Evento) WITH(DATA_COMPRESSION=PAGE)
GO
SQL Server 2008:
CREATE TABLE dbo.Historico_Query_Lenta (
    Dt_Evento DATETIME,
    Tp_Evento VARCHAR(50),
    session_id INT,
    database_id INT,
    [database_name] VARCHAR(128),
    [object_id] INT,
    [object_name] VARCHAR(128),
    username VARCHAR(128),
    session_nt_username VARCHAR(128),
    client_hostname VARCHAR(128),
    client_app_name VARCHAR(128),
    duration NUMERIC(18, 2),
    cpu_time NUMERIC(18, 2),
    reads BIGINT,
    writes BIGINT,
    sql_text VARCHAR(MAX)
) WITH (DATA_COMPRESSION = PAGE)
GO

CREATE CLUSTERED INDEX [SK01_Historico_Query_Lenta] ON [dbo].[Historico_Query_Lenta] ([Dt_Evento]) WITH (DATA_COMPRESSION = PAGE)
GO
Step 3 – Create the Stored Procedure to Capture the Data
Now that we are monitoring queries, we need to read the collected data and store it in a physical table for queries, as I configured the maximum file size to be very small (10 MB) so that queries are always fast. Depending on the number of heavy queries in your environment, you can increase or decrease the maximum size according to your environment.
To capture data in SQL Server 2012+, we will use the Stored Procedure below:
USE [dirceuresende]
GO

IF (OBJECT_ID('dbo.stpCarga_Query_Lenta') IS NULL) EXEC('CREATE PROCEDURE dbo.stpCarga_Query_Lenta AS SELECT 1')
GO

ALTER PROCEDURE dbo.stpCarga_Query_Lenta
AS
BEGIN


    DECLARE
        @TimeZone INT = DATEDIFF(HOUR, GETUTCDATE(), GETDATE()),
        @Dt_Ultimo_Registro DATETIME = ISNULL((SELECT MAX(Dt_Evento) FROM dbo.Historico_Query_Lenta), '1900-01-01')


    IF (OBJECT_ID('tempdb..#Eventos') IS NOT NULL) DROP TABLE #Eventos
    ;WITH CTE AS (
        SELECT CONVERT(XML, event_data) AS event_data
        FROM sys.fn_xe_file_target_read_file(N'C:\Traces\Query Lenta*.xel', NULL, NULL, NULL)
    )
    SELECT
        DATEADD(HOUR, @TimeZone, CTE.event_data.value('(//event/@timestamp)[1]', 'datetime')) AS Dt_Evento,
        CTE.event_data
    INTO
        #Eventos
    FROM
        CTE
    WHERE
        DATEADD(HOUR, @TimeZone, CTE.event_data.value('(//event/@timestamp)[1]', 'datetime')) > @Dt_Ultimo_Registro


    INSERT INTO dbo.Historico_Query_Lenta
    SELECT
        A.Dt_Evento,
        xed.event_data.value('(action[@name="session_id"]/value)[1]', 'int') AS session_id,
        xed.event_data.value('(action[@name="database_name"]/value)[1]', 'varchar(128)') AS [database_name],
        xed.event_data.value('(action[@name="username"]/value)[1]', 'varchar(128)') AS username,
        xed.event_data.value('(action[@name="session_server_principal_name"]/value)[1]', 'varchar(128)') AS session_server_principal_name,
        xed.event_data.value('(action[@name="session_nt_username"]/value)[1]', 'varchar(128)') AS [session_nt_username],
        xed.event_data.value('(action[@name="client_hostname"]/value)[1]', 'varchar(128)') AS [client_hostname],
        xed.event_data.value('(action[@name="client_app_name"]/value)[1]', 'varchar(128)') AS [client_app_name],
        CAST(xed.event_data.value('(//data[@name="duration"]/value)[1]', 'bigint') / 1000000.0 AS NUMERIC(18, 2)) AS duration,
        CAST(xed.event_data.value('(//data[@name="cpu_time"]/value)[1]', 'bigint') / 1000000.0 AS NUMERIC(18, 2)) AS cpu_time,
        xed.event_data.value('(//data[@name="logical_reads"]/value)[1]', 'bigint') AS logical_reads,
        xed.event_data.value('(//data[@name="physical_reads"]/value)[1]', 'bigint') AS physical_reads,
        xed.event_data.value('(//data[@name="writes"]/value)[1]', 'bigint') AS writes,
        xed.event_data.value('(//data[@name="row_count"]/value)[1]', 'bigint') AS row_count,
        TRY_CAST(xed.event_data.value('(//action[@name="sql_text"]/value)[1]', 'varchar(max)') AS XML) AS sql_text,
        TRY_CAST(xed.event_data.value('(//data[@name="batch_text"]/value)[1]', 'varchar(max)') AS XML) AS batch_text,
        xed.event_data.value('(//data[@name="result"]/text)[1]', 'varchar(100)') AS result
    FROM
        #Eventos A
        CROSS APPLY A.event_data.nodes('//event') AS xed (event_data)


END
If you are using SQL Server 2008, I prepared a Stored Procedure for you too 🙂
IF (OBJECT_ID('dbo.stpCarga_Query_Lenta') IS NULL) EXEC('CREATE PROCEDURE dbo.stpCarga_Query_Lenta AS SELECT 1')
GO

ALTER PROCEDURE dbo.stpCarga_Query_Lenta
AS
BEGIN


    DECLARE
        @TimeZone INT = DATEDIFF(HOUR, GETUTCDATE(), GETDATE()),
        @Dt_Ultimo_Registro DATETIME = ISNULL((SELECT MAX(Dt_Evento) FROM dbo.Historico_Query_Lenta), '1900-01-01')


    IF (OBJECT_ID('tempdb..#Eventos') IS NOT NULL) DROP TABLE #Eventos
    ;WITH CTE AS (
        SELECT CONVERT(XML, event_data) AS event_data
        FROM sys.fn_xe_file_target_read_file(N'C:\Traces\Query Lenta 2008*.xel', N'C:\Traces\Query Lenta 2008*.xem', NULL, NULL)
    )
    SELECT
        DATEADD(HOUR, @TimeZone, CTE.event_data.value('(//event/@timestamp)[1]', 'datetime')) AS Dt_Evento,
        CTE.event_data
    INTO
        #Eventos
    FROM
        CTE
    WHERE
        DATEADD(HOUR, @TimeZone, CTE.event_data.value('(//event/@timestamp)[1]', 'datetime')) > @Dt_Ultimo_Registro


    INSERT INTO dbo.Historico_Query_Lenta
    (
        Dt_Evento,
        Tp_Evento,
        session_id,
        database_id,
        [database_name],
        [object_id],
        [object_name],
        username,
        session_nt_username,
        client_hostname,
        client_app_name,
        duration,
        cpu_time,
        reads,
        writes,
        sql_text
    )
    SELECT
        A.Dt_Evento,
        xed.event_data.value('@name[1]', 'varchar(128)') AS event_name,
        xed.event_data.value('(action[@name="session_id"]/value)[1]', 'int') AS session_id,
        xed.event_data.value('(action[@name="database_id"]/value)[1]', 'int') AS [database_id],
        DB_NAME(xed.event_data.value('(action[@name="database_id"]/value)[1]', 'int')) AS [database_name],
        xed.event_data.value('(data[@name="object_id"]/value)[1]', 'int') AS [object_id],
        OBJECT_NAME(xed.event_data.value('(data[@name="object_id"]/value)[1]', 'int'), xed.event_data.value('(action[@name="database_id"]/value)[1]', 'int')) AS [object_name],
        xed.event_data.value('(action[@name="username"]/value)[1]', 'varchar(128)') AS username,
        xed.event_data.value('(action[@name="session_nt_username"]/value)[1]', 'varchar(128)') AS [session_nt_username],
        xed.event_data.value('(action[@name="client_hostname"]/value)[1]', 'varchar(128)') AS [client_hostname],
        xed.event_data.value('(action[@name="client_app_name"]/value)[1]', 'varchar(128)') AS [client_app_name],
        CAST(xed.event_data.value('(//data[@name="duration"]/value)[1]', 'bigint') / 1000000.0 AS NUMERIC(18, 2)) AS duration,
        CAST(xed.event_data.value('(//data[@name="cpu"]/value)[1]', 'bigint') / 1000000.0 AS NUMERIC(18, 2)) AS cpu_time,
        xed.event_data.value('(//data[@name="reads"]/value)[1]', 'bigint') AS reads,
        xed.event_data.value('(//data[@name="writes"]/value)[1]', 'bigint') AS writes,
        xed.event_data.value('(//action[@name="sql_text"]/value)[1]', 'varchar(max)') AS sql_text
    FROM
        #Eventos A
        CROSS APPLY A.event_data.nodes('//event') AS xed (event_data)


END
Step 4 – Create a job in SQL Agent to automate data collection
So that the collected data is always written to the table we created, you must now create a Job in SQL Server Agent to automate the execution of the Stored Procedure created in Item 3, according to the frequency that you need the data to be written.
My suggestion is to start with executions every 10 minutes and adjust this time as necessary.
Below, I will share an example of code for creating the Job, but I believe that creating it using the SQL Server Management Studio (SSMS) interface is much more practical and intuitive, right?
USE [msdb]
GO
DECLARE @jobId BINARY(16)
EXEC  msdb.dbo.sp_add_job @job_name=N'DBA - Coleta de Query Lenta',
		@enabled=1,
		@notify_level_eventlog=0,
		@notify_level_email=2,
		@notify_level_page=2,
		@delete_level=0,
		@category_name=N'Database Maintenance',
		@owner_login_name=N'dirceu.resende', @job_id = @jobId OUTPUT
select @jobId
GO
EXEC msdb.dbo.sp_add_jobserver @job_name=N'DBA - Coleta de Query Lenta', @server_name = N'SQLSERVER\SQL2017'
GO
USE [msdb]
GO
EXEC msdb.dbo.sp_add_jobstep @job_name=N'DBA - Coleta de Query Lenta', @step_name=N'Executa SP',
		@step_id=1,
		@cmdexec_success_code=0,
		@on_success_action=1,
		@on_fail_action=2,
		@retry_attempts=0,
		@retry_interval=0,
		@os_run_priority=0, @subsystem=N'TSQL',
		@command=N'EXEC dbo.stpCarga_Query_Lenta',
		@database_name=N'dirceuresende',
		@flags=8
GO
USE [msdb]
GO
EXEC msdb.dbo.sp_update_job @job_name=N'DBA - Coleta de Query Lenta',
		@enabled=1,
		@start_step_id=1,
		@notify_level_eventlog=0,
		@notify_level_email=2,
		@notify_level_page=2,
		@delete_level=0,
		@description=N'',
		@category_name=N'Database Maintenance',
		@owner_login_name=N'dirceu.resende',
		@notify_email_operator_name=N'',
		@notify_page_operator_name=N''
GO
USE [msdb]
GO
DECLARE @schedule_id int
EXEC msdb.dbo.sp_add_jobschedule @job_name=N'DBA - Coleta de Query Lenta', @name=N'A cada 10 minutos',
		@enabled=1,
		@freq_type=4,
		@freq_interval=1,
		@freq_subday_type=4,
		@freq_subday_interval=10,
		@freq_relative_interval=0,
		@freq_recurrence_factor=1,
		@active_start_date=20190218,
		@active_end_date=99991231,
		@active_start_time=112,
		@active_end_time=235959, @schedule_id = @schedule_id OUTPUT
select @schedule_id
GO
And finally, now that our monitoring is activated and we already have a job to automate the collection of this data and write it to a database table, we can consult the data in this table whenever it is necessary to identify slow queries in our environment.
Execution example:
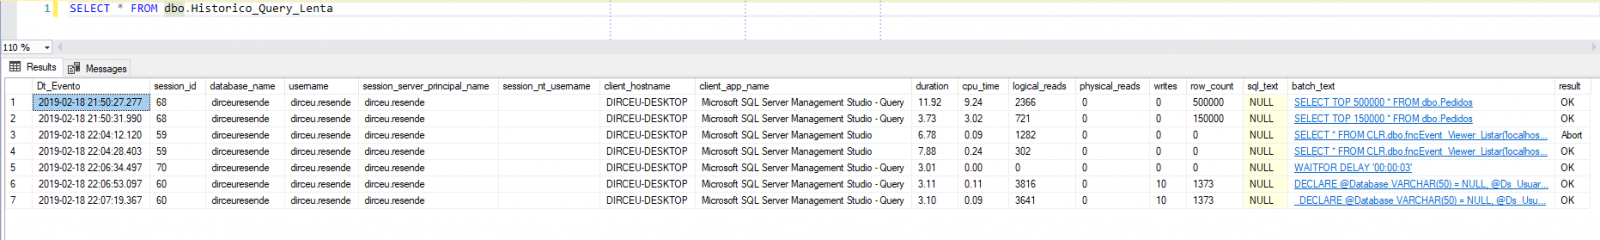
Note that the last column (Result) informs us whether the command was executed successfully or whether it was interrupted. Pretty cool, right?
I hope you liked this tip, a big hug and see you in the next article.

Comments (0)
Loading comments...