Hey guys,
Good afternoon!
In this post, I will demonstrate how to obtain important information about various events that occur in the SQL Server instance without having to activate any control or audit, just by reading the information already collected by the standard SQL Server trace.
Although I have already talked about this in some other posts, I decided to close this topic and make a post with several more examples of use.
The standard SQL trace collects 34 different types of events, which can be generated manually by tools such as SQL Server Profiler or with Transact-SQL queries.
The examples below show how to get information from different types of events, such as Shrink, AutoGrow, Automatic Statistics Update, Backup/Restore, DBCC, Missing Column Statistics, among others.
An important point to note is that this standard SQL Server trace runs in the background by default, collecting only a few events and therefore generates minimal impact on the SQL Server instance.
When activating a trace using SQL Server Profiler, which displays results in real time through the interface, you may end up generating impacts such as performance degradation in the environment, especially if you do not filter very well just the events you want to observe and which criteria will be defined to identify the sessions that will be part of the Trace.
SQL Server default trace
Normally, we only have the standard trace running on our SQL Server instance, which is enabled by default, although in some environments you may find more than one trace running, if a DBA creates a custom trace.
Listing active traces on the instance
To list the active traces in the instance, you can use the query below:
SELECT * FROM sys.traces

Identifying the default trace
Although the default trace is usually the trace with ID = 1, this is not always the case. Therefore, I recommend using the query below to identify the default trace:
SELECT * FROM sys.traces WHERE is_default = 1
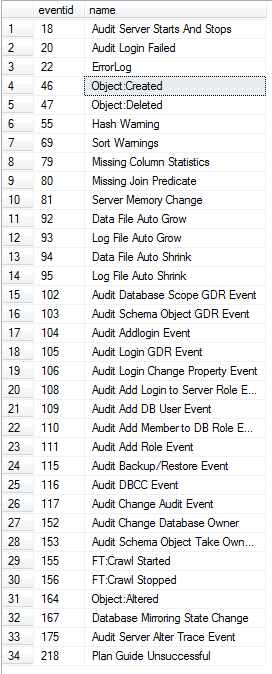
Listing standard trace events
As mentioned above, the standard SQL Server trace collects 34 different events. To identify the complete list of events, simply run this query:
DECLARE @id INT = ( SELECT id FROM sys.traces WHERE is_default = 1 )

SELECT DISTINCT
    eventid,
    name
FROM
    fn_trace_geteventinfo(@id) EI
    JOIN sys.trace_events TE ON EI.eventid = TE.trace_event_id
Activating Standard Trace (Already enabled after installation)
To activate the default SQL Server trace, it's very simple, just run sp_configure:
EXEC sp_configure 'show advanced options', 1;
GO
RECONFIGURE;
GO
EXEC sp_configure 'default trace enabled', 1;
GO
RECONFIGURE;
GO
EXEC sp_configure 'show advanced options', 0;
GO
RECONFIGURE;
GO
Disabling Standard Trace
Disabling the default SQL Server trace is as simple as activating it. Just run sp_configure:
EXEC sp_configure 'show advanced options', 1;
GO
RECONFIGURE;
GO
EXEC sp_configure 'default trace enabled', 0;
GO
RECONFIGURE;
GO
EXEC sp_configure 'show advanced options', 0;
GO
RECONFIGURE;
GO
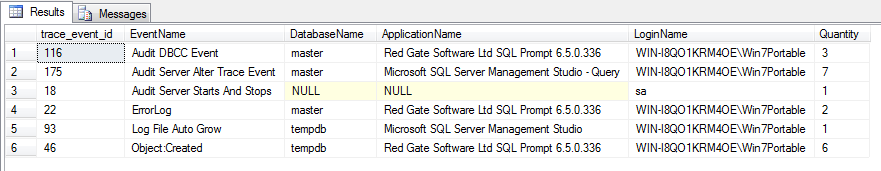
Identifying the events
A simple way to identify the events that occurred in the instance is by running the query below:
DECLARE @path VARCHAR(MAX) = (SELECT [path] FROM sys.traces WHERE is_default = 1)

SELECT
    B.trace_event_id,
    B.name AS EventName,
    A.DatabaseName,
    A.ApplicationName,
    A.LoginName,
    COUNT(*) AS Quantity
FROM
    sys.fn_trace_gettable(@path, DEFAULT) A
    INNER JOIN sys.trace_events B ON A.EventClass = B.trace_event_id
GROUP BY
    B.trace_event_id,
    B.name,
    A.DatabaseName,
    A.ApplicationName,
    A.LoginName
ORDER BY
    B.name,
    A.DatabaseName,
    A.ApplicationName,
    A.LoginName
Identifying Autogrowth Events
One of the most important events that we can observe with the standard trace are the Autogrowth events, which occur when this option is enabled in the database and it reaches its maximum size, requiring more space to be allocated on the disk.
DECLARE @path VARCHAR(MAX) = (SELECT [path] FROM sys.traces WHERE is_default = 1)

SELECT
    DatabaseName,
    [FileName],
    CASE EventClass
      WHEN 92 THEN 'Data File Auto Grow'
      WHEN 93 THEN 'Log File Auto Grow'
    END AS EventClass,
    Duration,
    StartTime,
    EndTime,
    SPID,
    ApplicationName,
    LoginName
FROM
    sys.fn_trace_gettable(@path, DEFAULT)
WHERE
    EventClass IN ( 92, 93 )
ORDER BY
    StartTime DESC
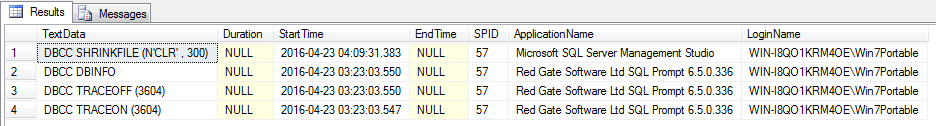
Identifying Disk Shrink Events
Another really cool event to monitor is the Disk Shrink event, which occurs when the database is allocating more space than it is using and the DBA reallocates the allocated space, resulting in free space in the filesystem.
DECLARE @path VARCHAR(MAX) = (SELECT [path] FROM sys.traces WHERE is_default = 1)

SELECT
    TextData,
    Duration,
    StartTime,
    EndTime,
    SPID,
    ApplicationName,
    LoginName
FROM
    sys.fn_trace_gettable(@path, DEFAULT)
WHERE
    EventClass IN ( 116 ) AND TextData LIKE 'DBCC%SHRINK%'
ORDER BY
    StartTime DESC
Identifying when DBCC commands were executed on the instance
Very useful audit to identify who executed or when a DBCC command was executed on the instance
DECLARE @path VARCHAR(MAX) = (SELECT [path] FROM sys.traces WHERE is_default = 1)

SELECT
    TextData,
    Duration,
    StartTime,
    EndTime,
    SPID,
    ApplicationName,
    LoginName
FROM
    sys.fn_trace_gettable(@path, DEFAULT)
WHERE
    EventClass IN ( 116 )
ORDER BY
    StartTime DESC
Identifying when backups were performed
Another very interesting audit for the DBA, which makes it possible to identify the date and who ran the backups on the instance (which can also be consulted in the msdb.dbo.backupset table).
DECLARE @path VARCHAR(MAX) = (SELECT [path] FROM sys.traces WHERE is_default = 1)

SELECT
    DatabaseName,
    TextData,
    Duration,
    StartTime,
    EndTime,
    SPID,
    ApplicationName,
    LoginName
FROM
    sys.fn_trace_gettable(@path, DEFAULT)
WHERE
    EventClass IN ( 115 )
    AND EventSubClass = 1
ORDER BY
    StartTime DESC
Identifying when backups were restored
Very interesting audit that allows you to identify the date and which user performed a restore on the instance (which can also be consulted in the msdb.dbo.restorehistory, msdb.dbo.restorefile and msdb.dbo.restorefilegroup tables)
DECLARE @path VARCHAR(MAX) = (SELECT [path] FROM sys.traces WHERE is_default = 1)

SELECT
    TextData,
    Duration,
    StartTime,
    EndTime,
    SPID,
    ApplicationName,
    LoginName
FROM
    sys.fn_trace_gettable(@path, DEFAULT)
WHERE
    EventClass IN ( 115 )
    AND EventSubClass = 2
ORDER BY
    StartTime DESC
These are just a few examples of what the standard trace returns. There is an extensive list of events for you to explore!
Good luck, hugs and see you in the next post!

Comments (0)
Loading comments...